Modern football (or soccer like an Australian would say) was invented by the English at the end of the nineteenth century and it is now the most widely played sport in the world. Most of the countries in the world host a football league, with the European leagues being the undisputed leading football schools as far as game quality and technique are concerned. Each European league has its own way of playing football:
- The English (Premier League) favour physical strength, competitiveness and commitment. The English way is: score, score, score!
- The Italians (Serie A) are known for the “catenaccio”, a strategy which prefers defence and strategy to attack. The rule is: defend and, if possible, score!
- The Spanish (La Liga) are famous for their technique. The ball gets passed around with fast-short-ground pass in order to tire the opponent and kick the ball in: pass,pass,pass,pass,pass,pass,score!
- The French (Ligue 1) prefer physical strength to technique and in some cases they combine the two (see Zidane, Platini, Henry).
- The Germans (Bundesliga) are precise and efficient. The German technique is a hybrid between the defensive strategy of Serie A and the offensive strategy of Permier League. I was curious to see how the statistics of these five leagues compared with each other. What do the data tell us about the way of playing soccer of these five leagues?
The data consist in the final tables (from about 1930 to date, with the exception of Bundesliga) of each league. The source consists in 387 Wikipedia wepages, one for each league during a particular year. For each team, the data are: the number of games won-lost-drawn, goals for-against and final points. Data were fetched, manipulated and visualized with a programming language called python (for geeks only: numpy, pandas, BeautifulSoup, seaborn). If you are curious to know what happens behind the scenes, here you can find the source code and here is a tutorial on how to use it so that you can draw your own statistics from the data.
The first thing to think about is that the number of teams per league is not a constant. Moreover, the number of teams can change with years as you can see from the first figure.
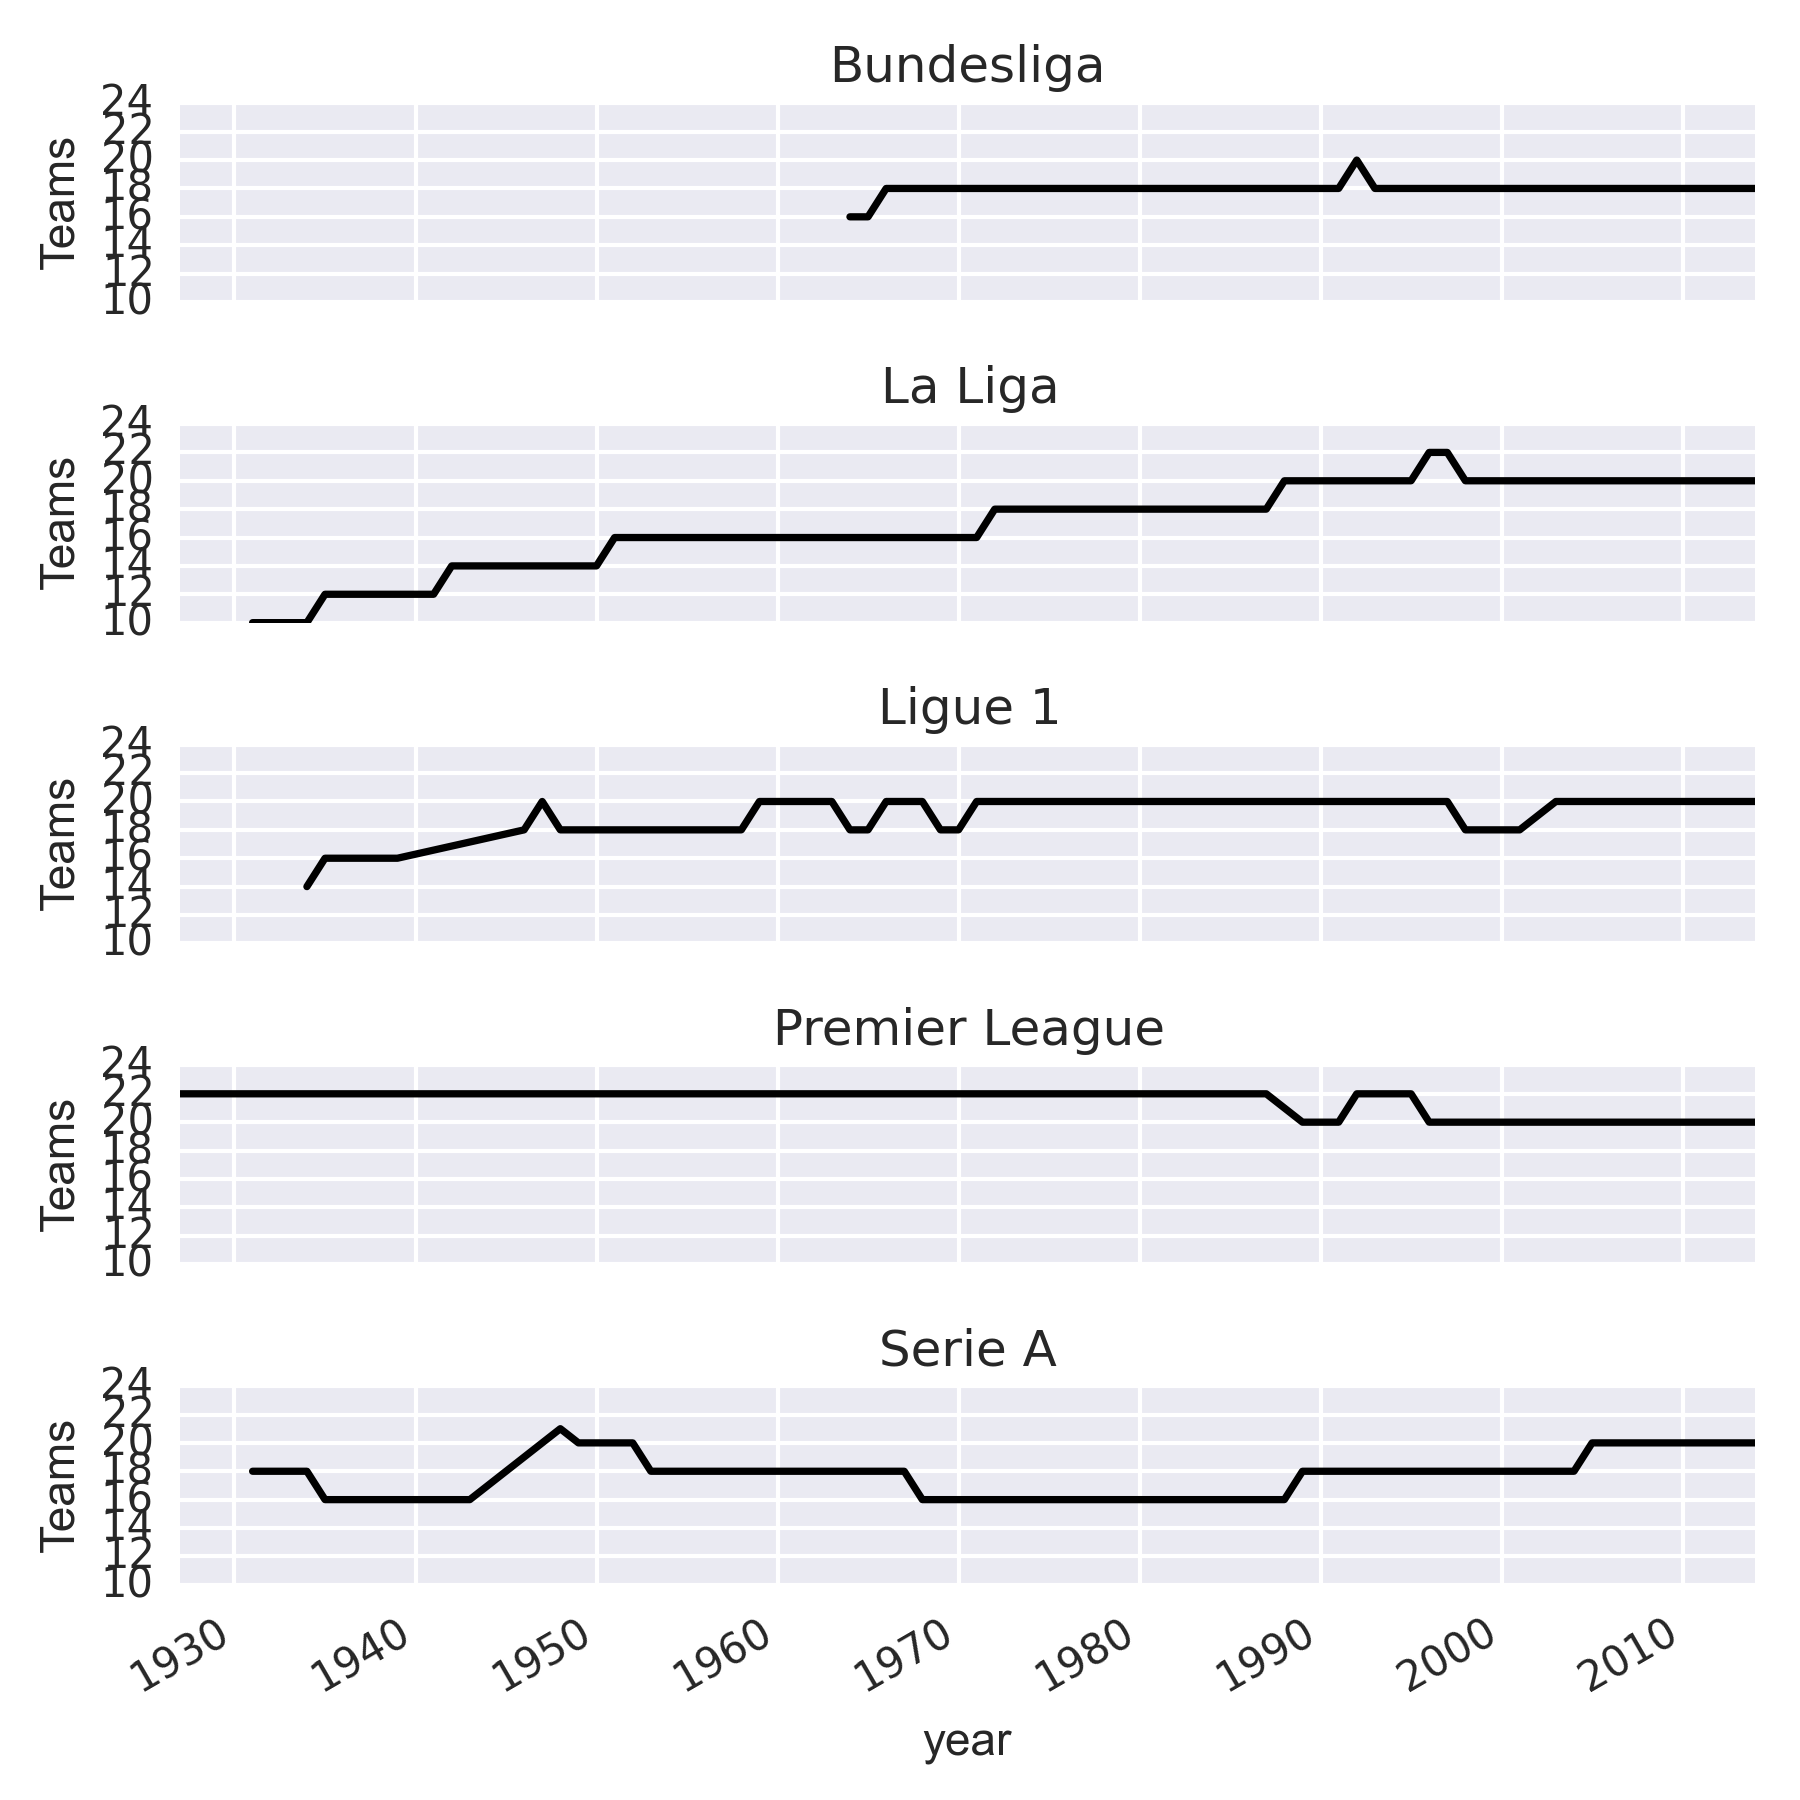
The English were already “full-on” in the 20’s, whereas the other leagues somehow evolved with time. Note that most of the leagues were suspended around 1944-1947 because of the second world war. I filled these gaps using an interpolation technique .
With this in mind, you understand that if we compare the average number of victories in La Liga in 1970 with the average number of victories in the Premier League in 1970, this will not be a fair comparison because Premier League had twice the number of teams as La Liga. A way to approach this issue is to divide our quantity of interest by the number of teams per league during a particular year. The difference between the two approaches is clear in the following figure:
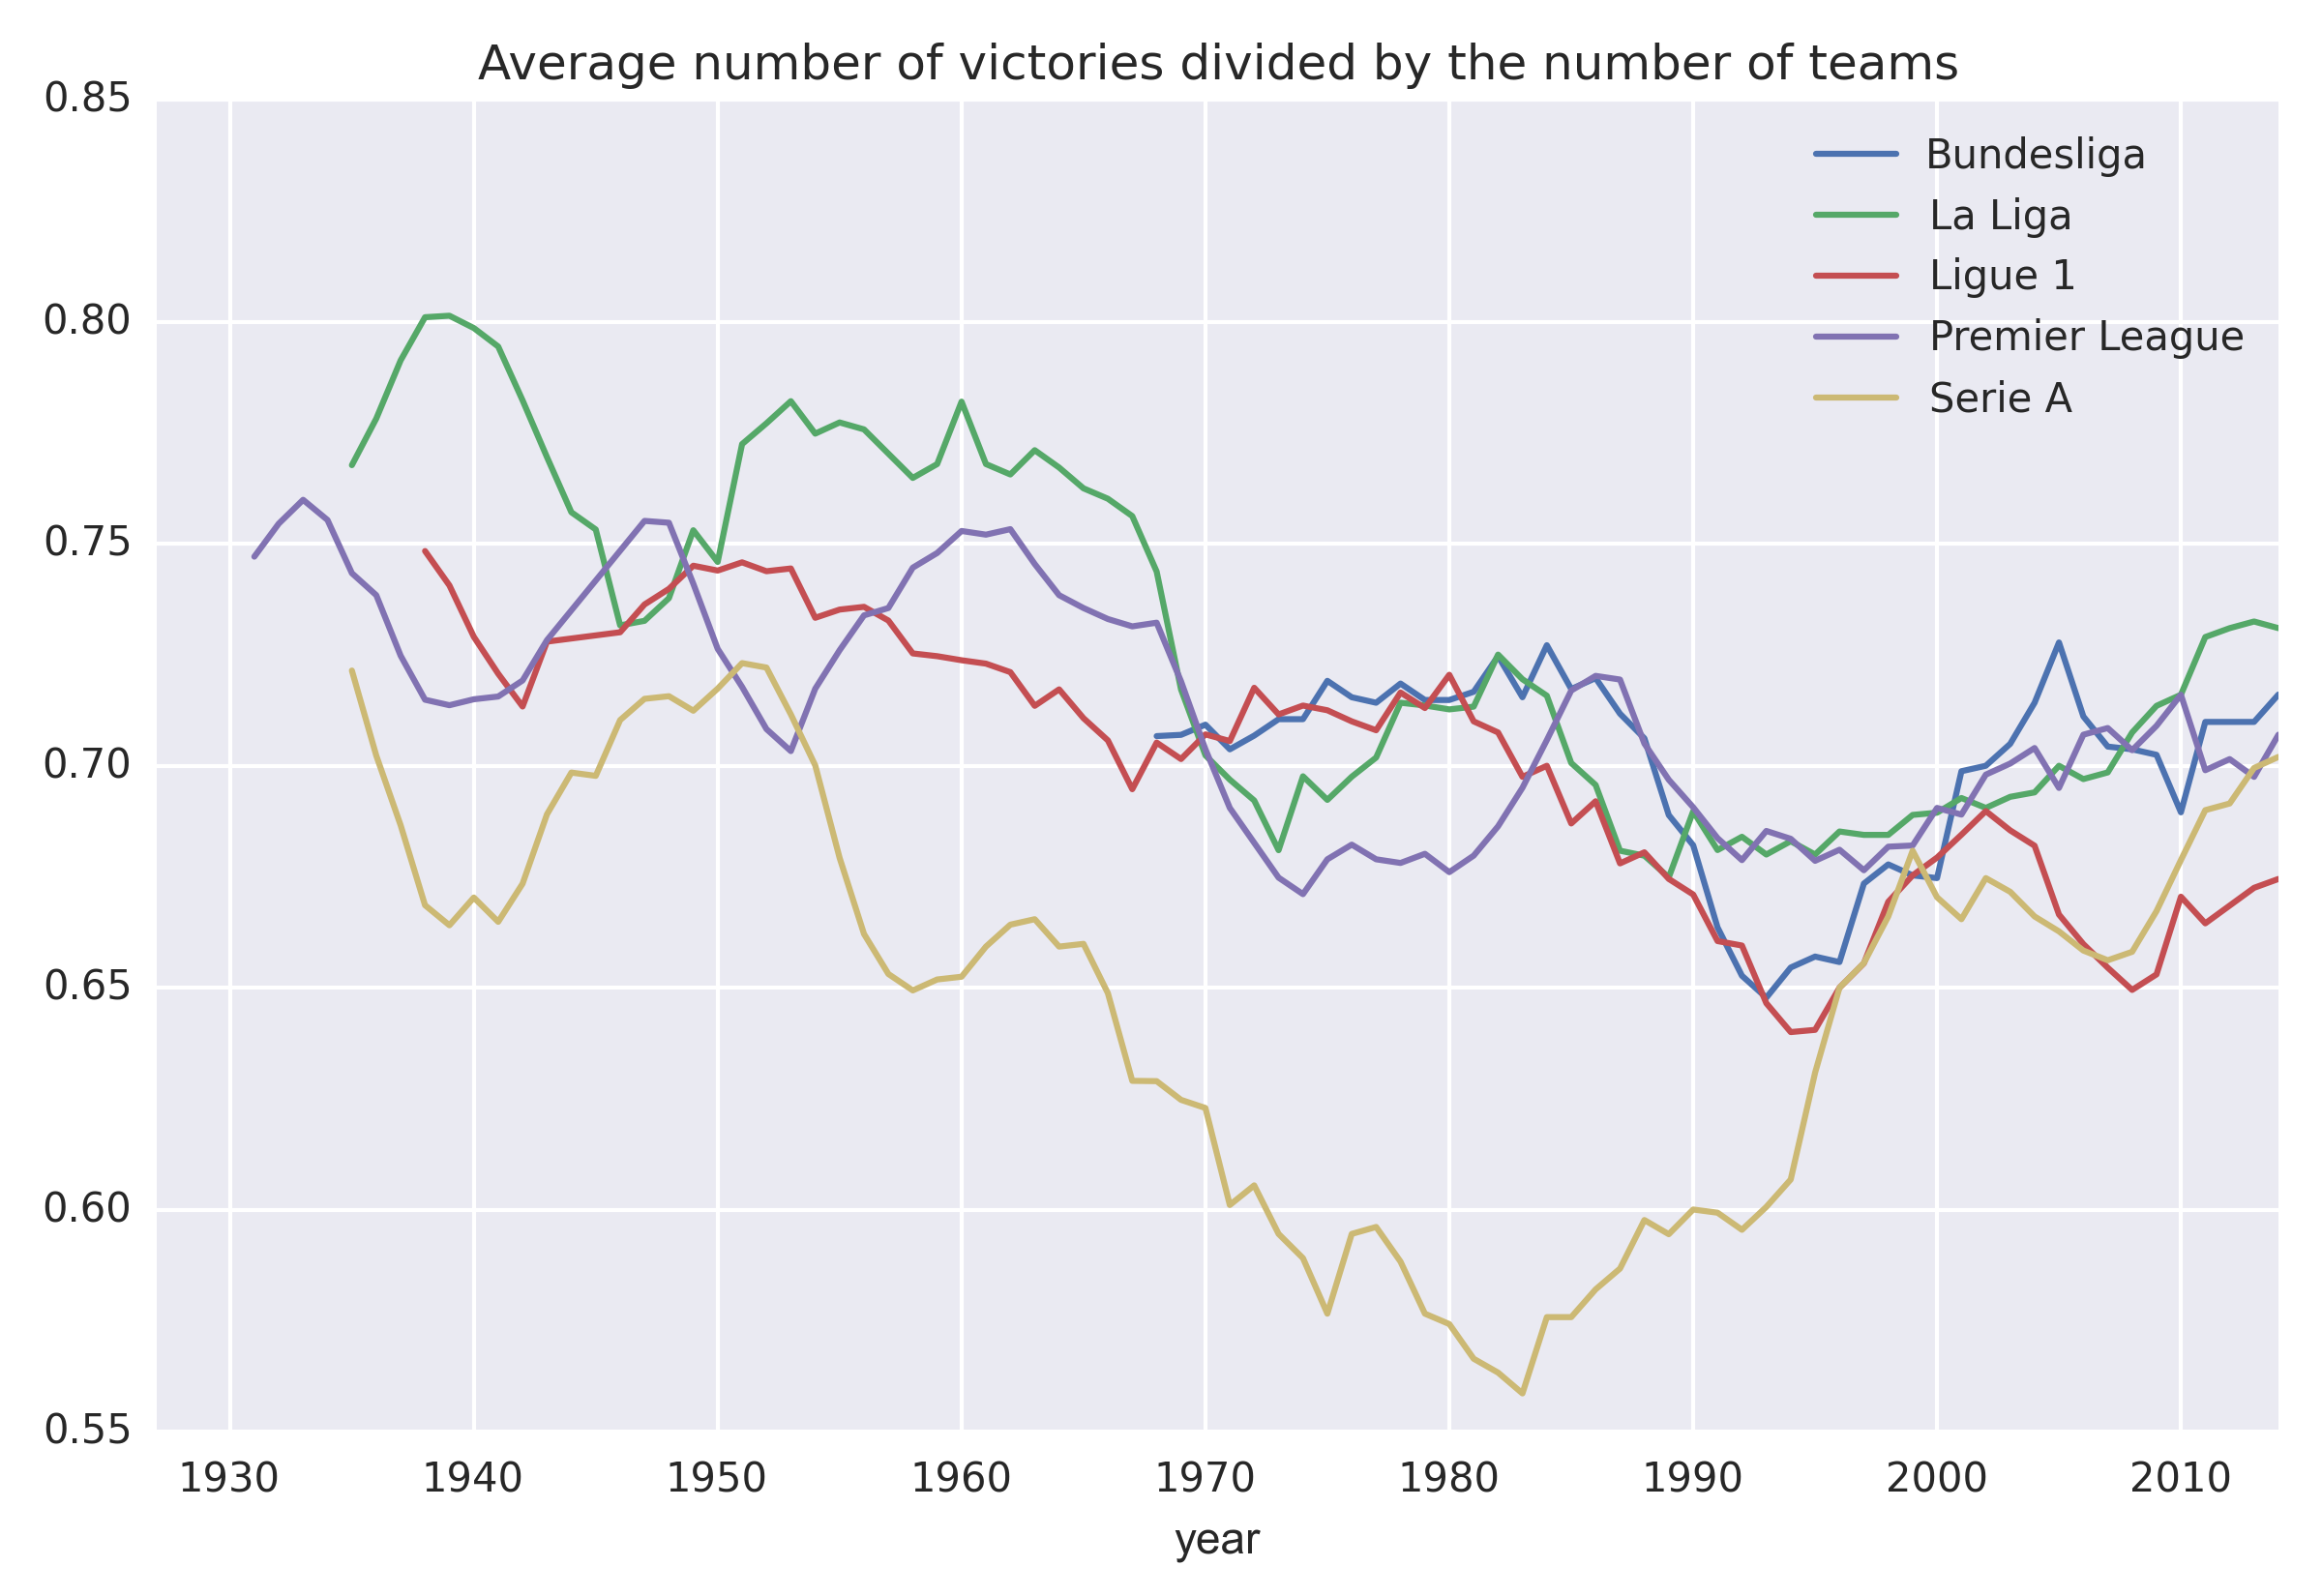
Looking at the average number of victories divided by the number of teams we notice two interesting things:
-
the average number victories has decreased with respect to 50 years ago.
-
Serie A is the league which wins less, which is in agreement with the fact that Italians prefer a more defensive strategy. In the 80s, thanks to influential coaches like Arrigo Sacchi, Serie A teams gradually abandoned the rigid catenaccio strategy and started to win more and more games, which explains the rise of the yellow curve in the figure above.
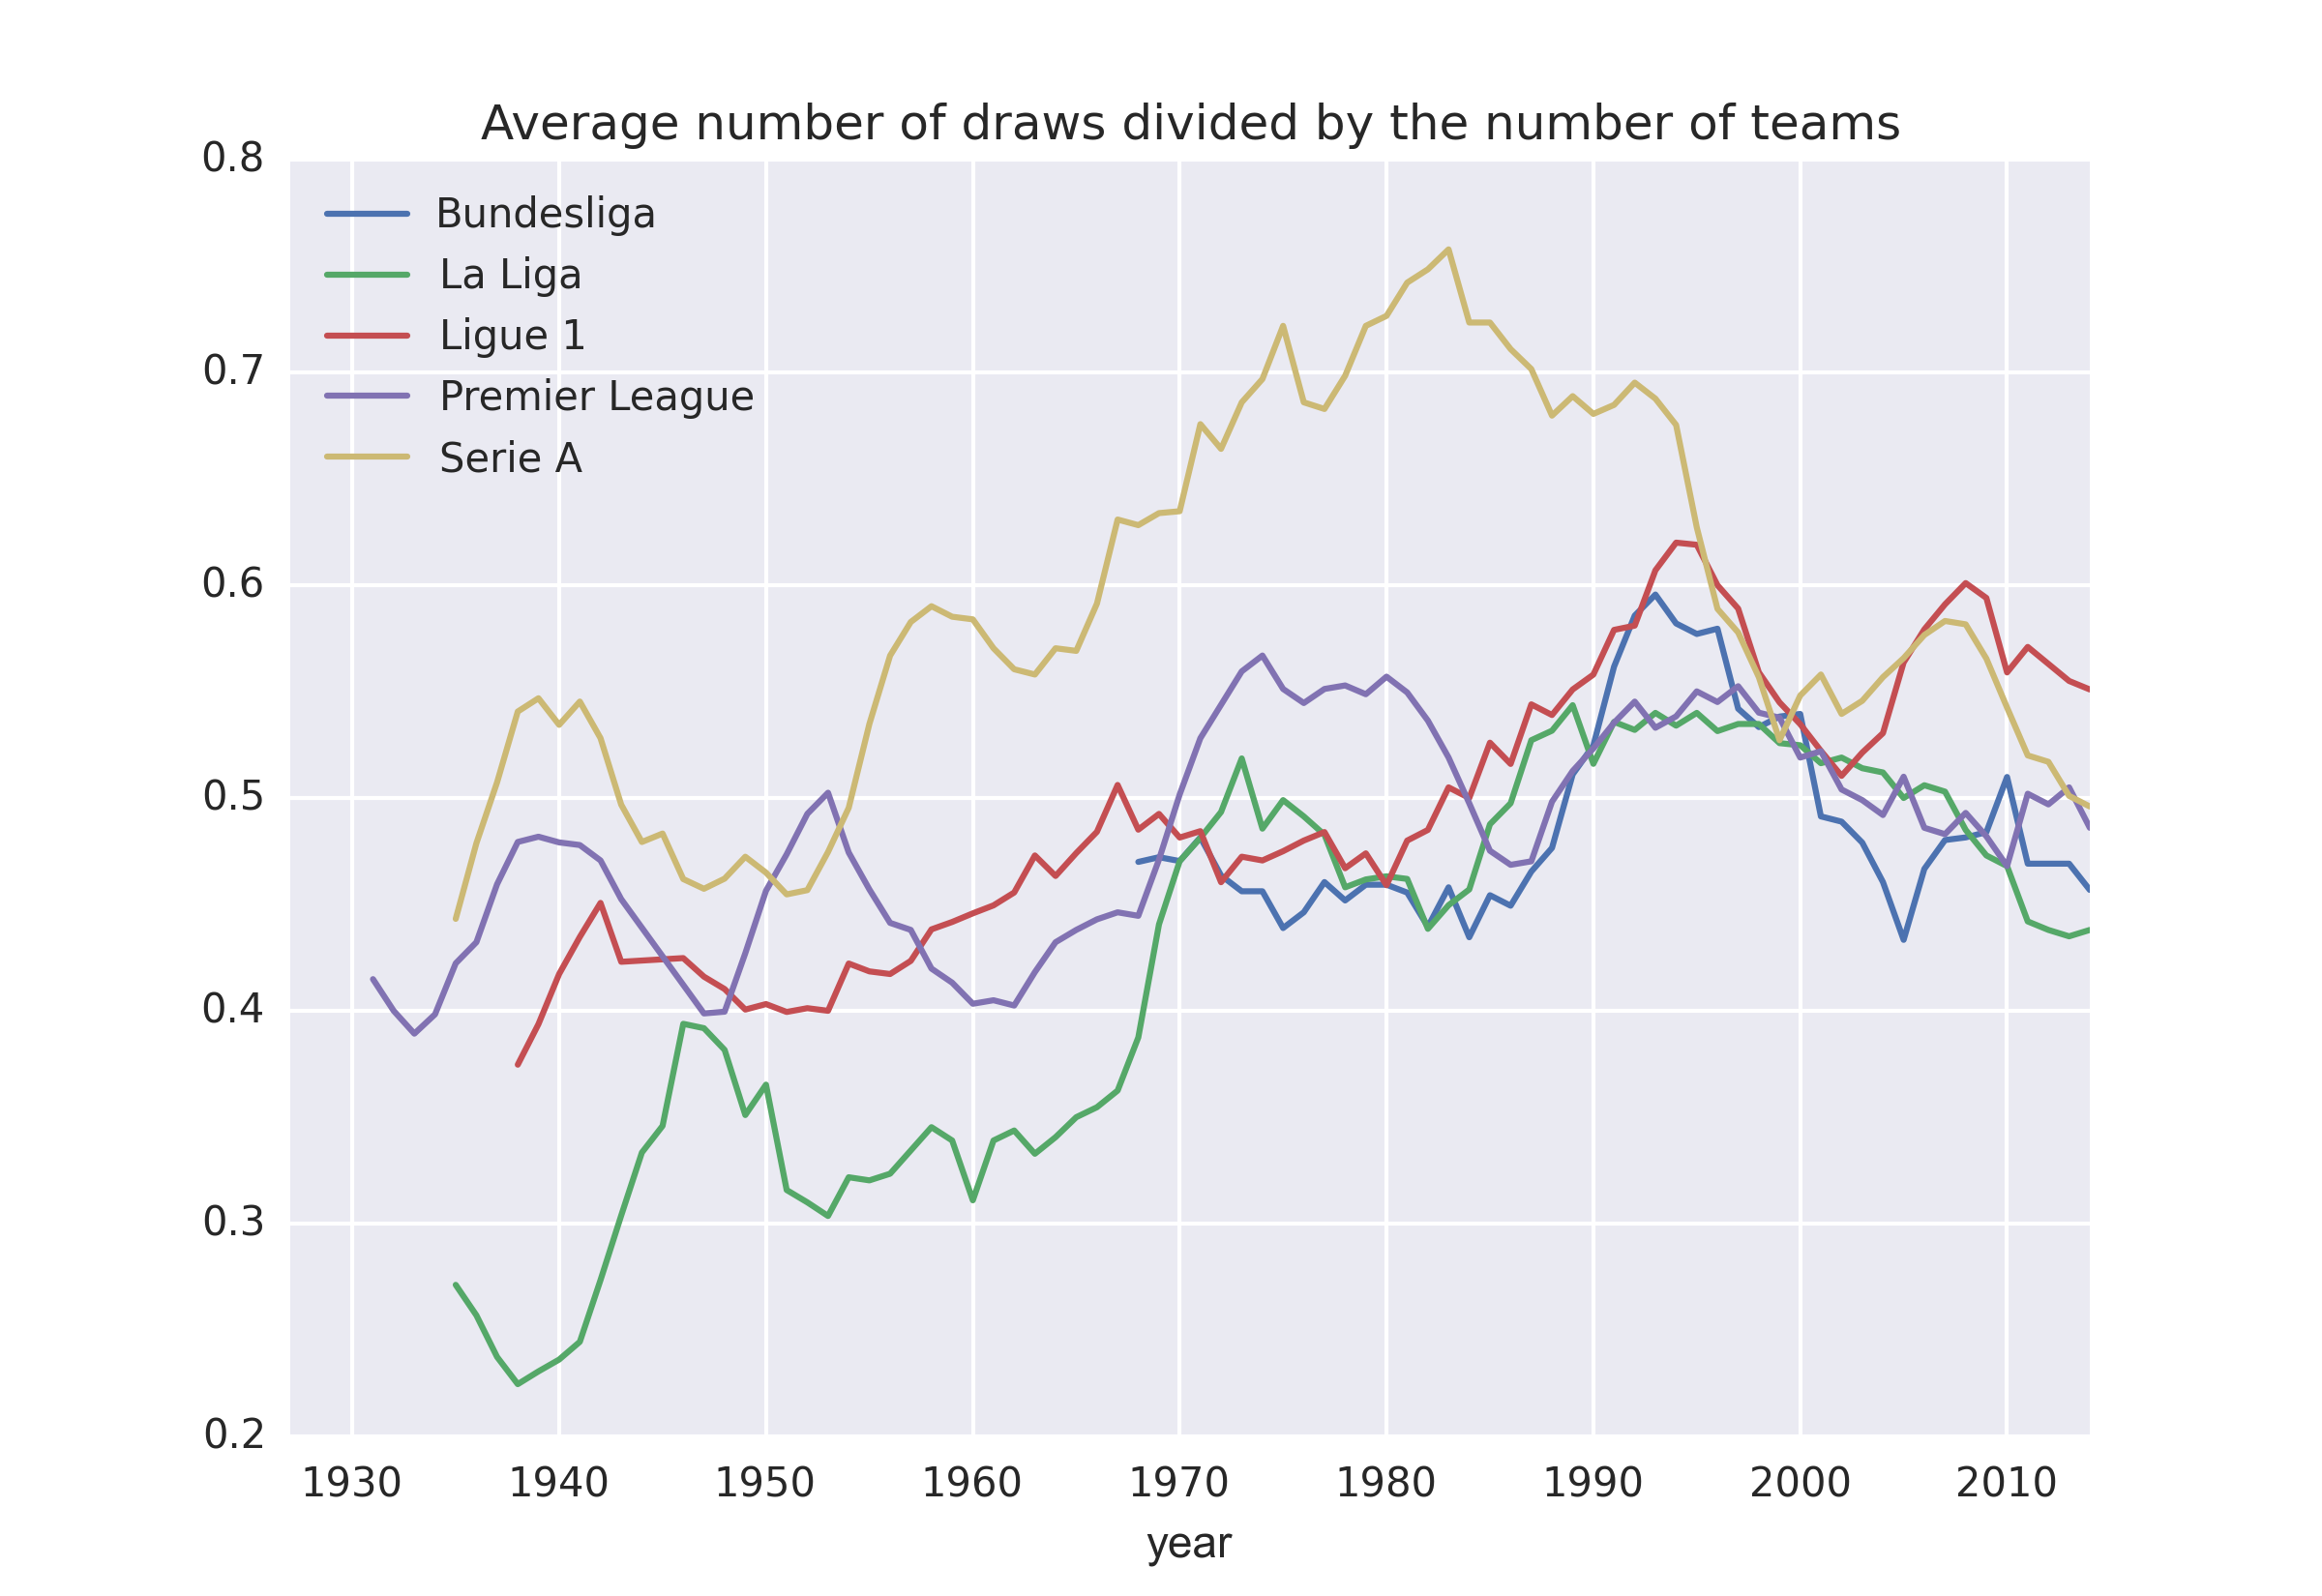
Having a low number of average victories does not mean that teams lose, but rather than they tie. This is confirmed by the average number of draws per year, which again confirms that Serie A games in the 70’s and 80’s were very boring to watch.
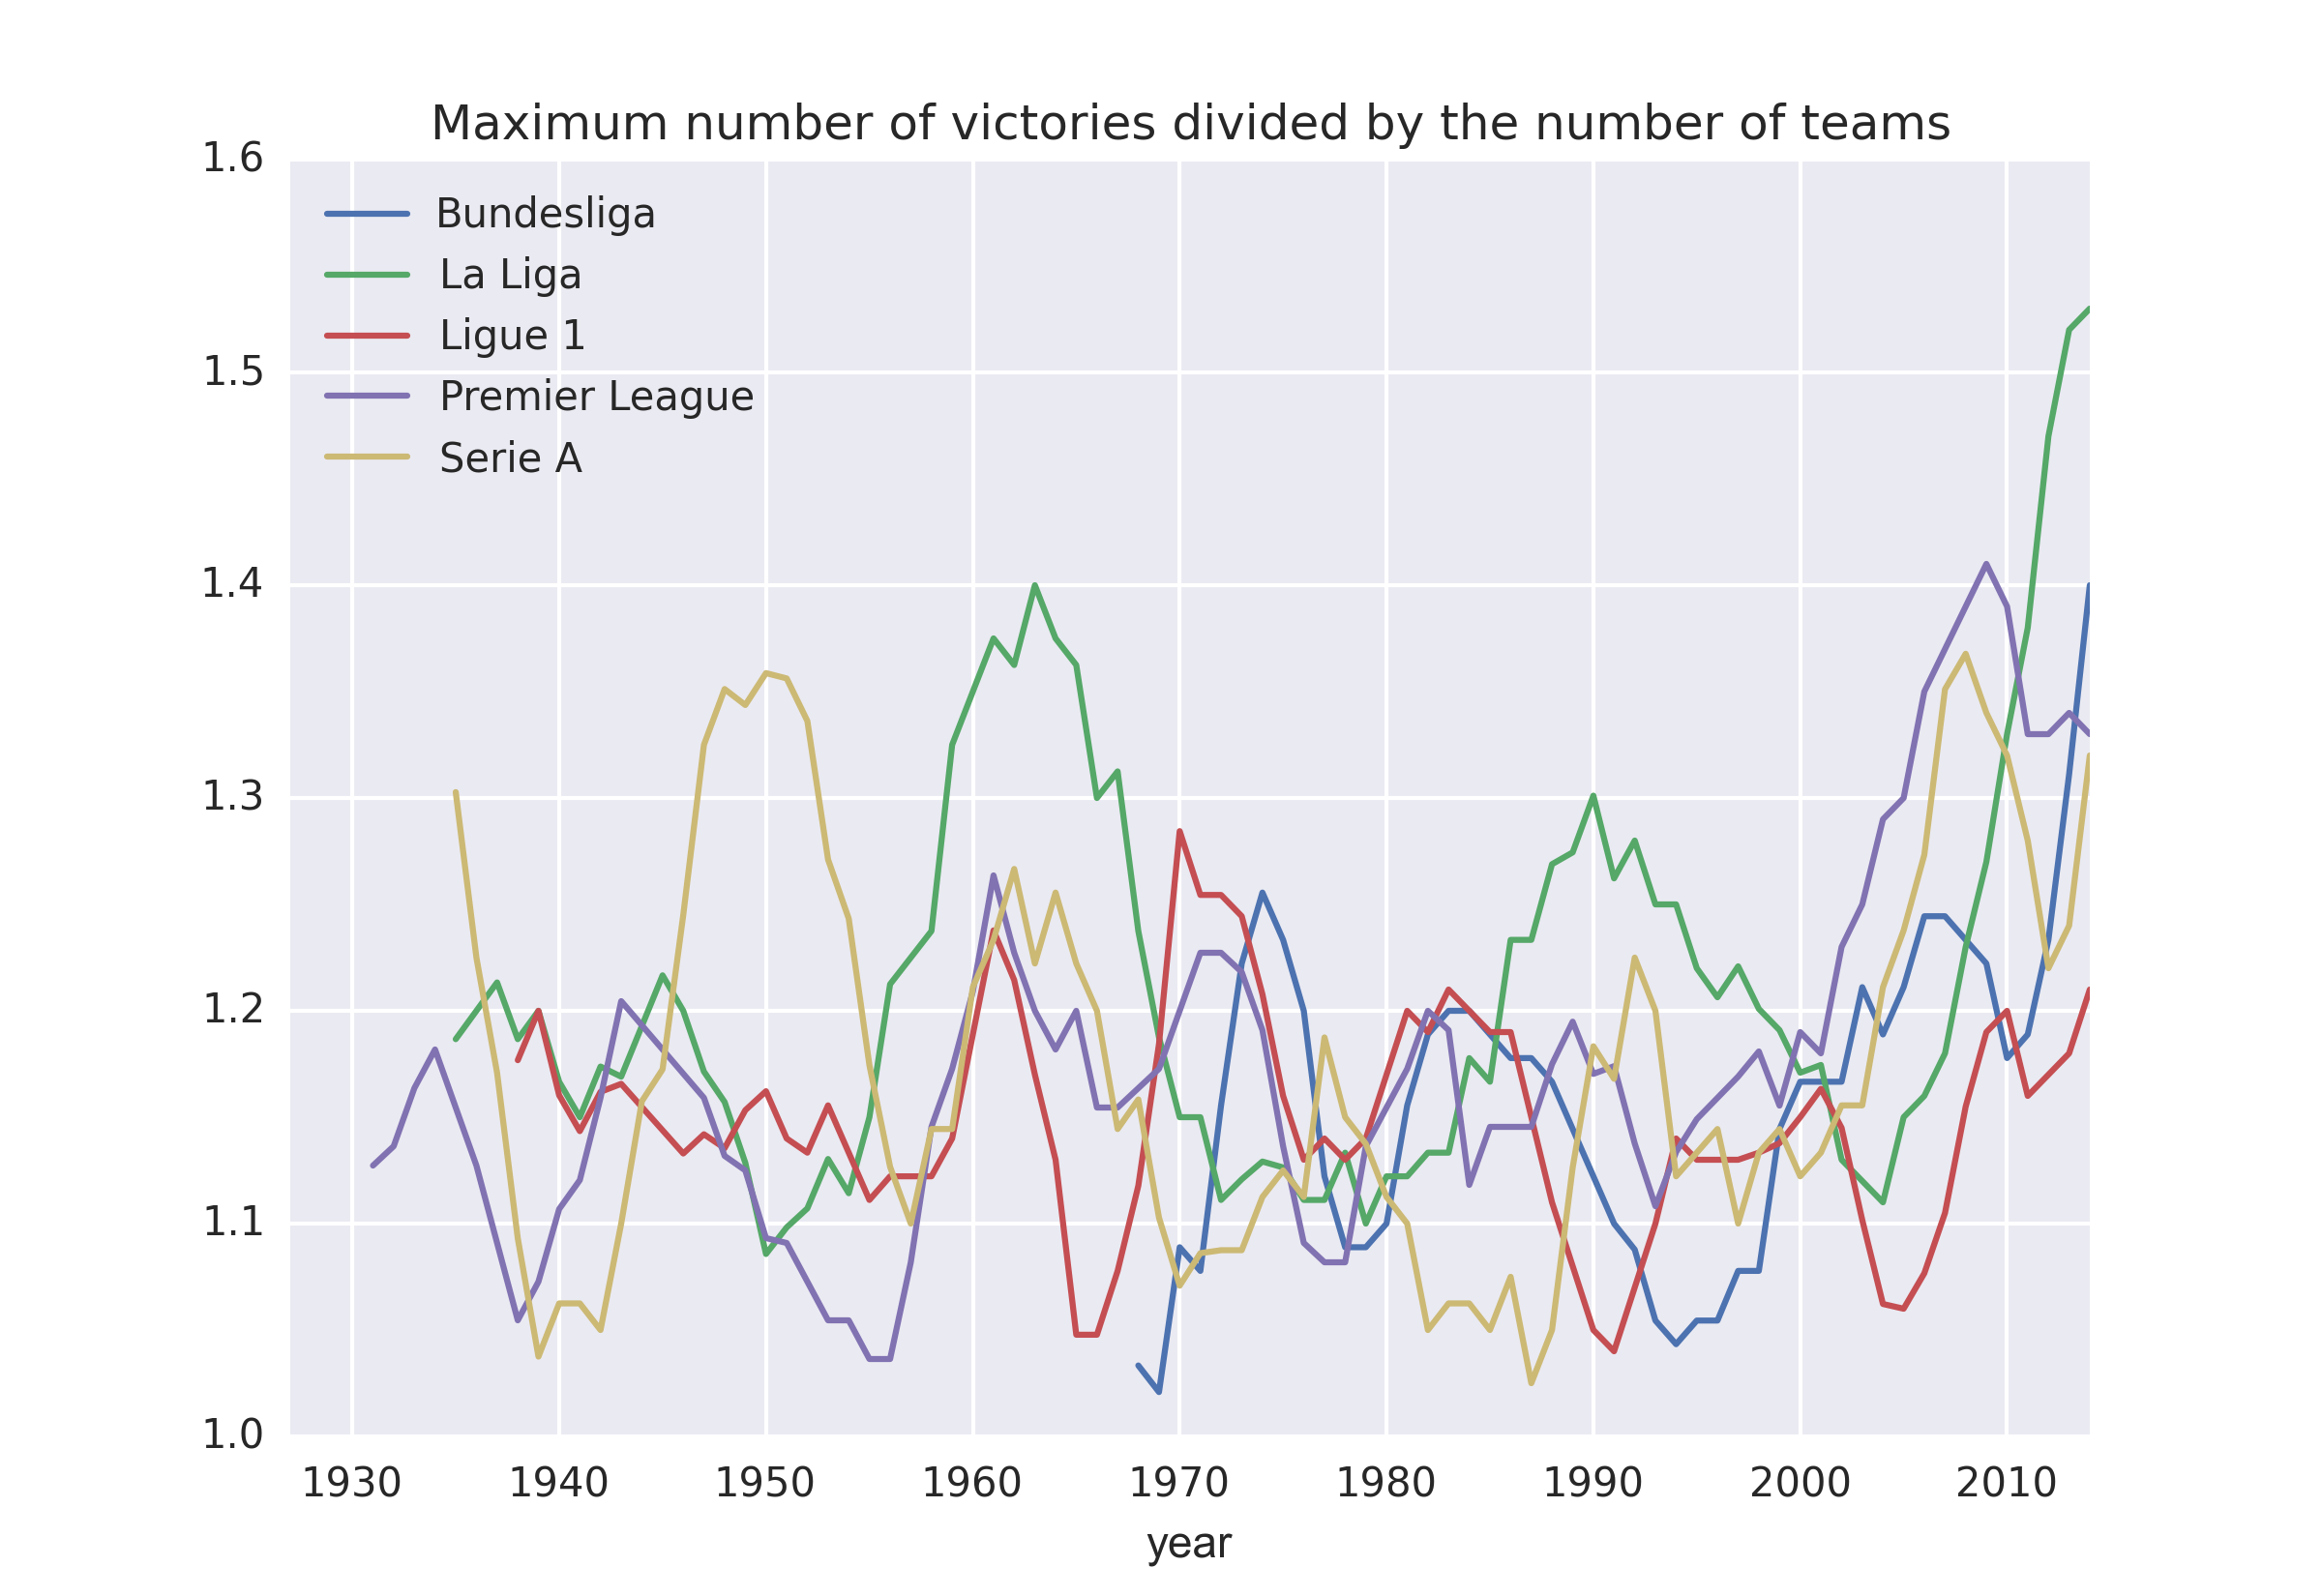
We can get additional insights into the data if, instead of looking at the average number of victories per year, we look at the maximum number of victories per year. Such analysis concerns only the best teams, those which won the championship during a particular year.
In this case, league statistics are more consistent with each other, but I find interesting the trend observed for La Liga, which shows a boost in the maximum number of victories with a period of about 25 years. Moreover, the superior quality of Barcelona and Real Madrid in the last 10 years has produced a further peak in maximum number of victories, the highest ever recorded.
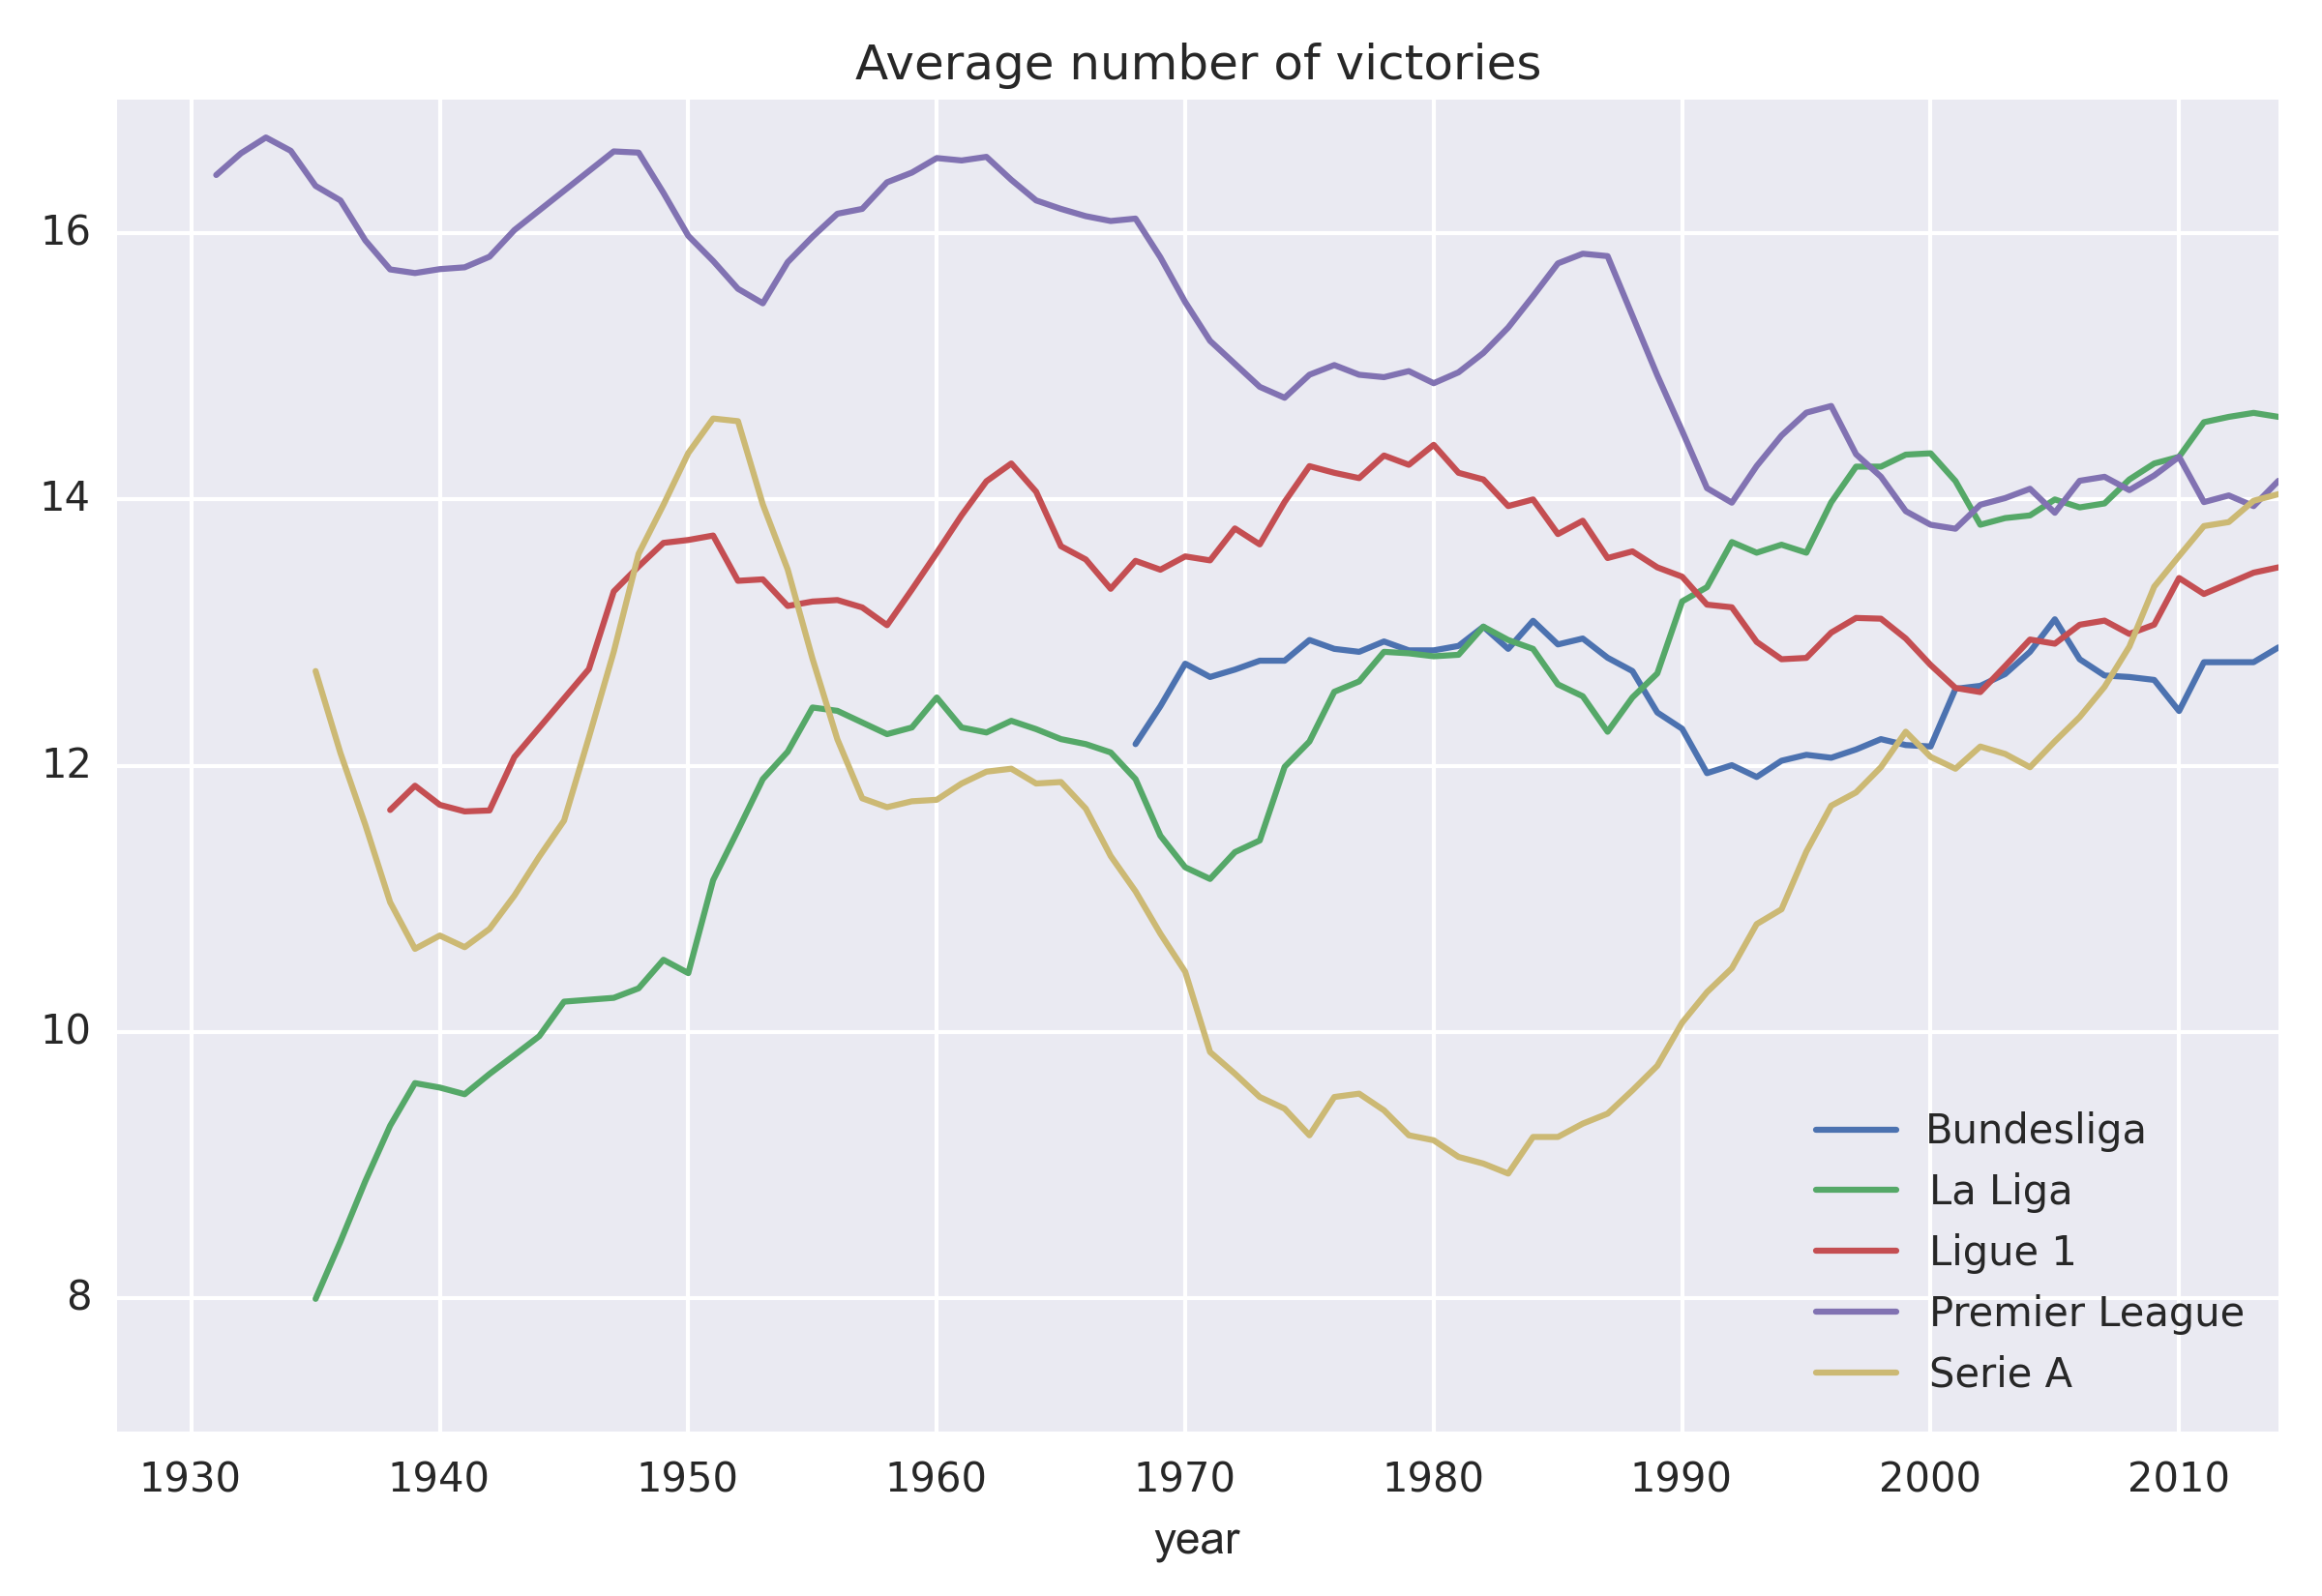
Now, let’s look at the average number of goals scored (divided by the number of teams) as a function of year. This one looks very interesting.
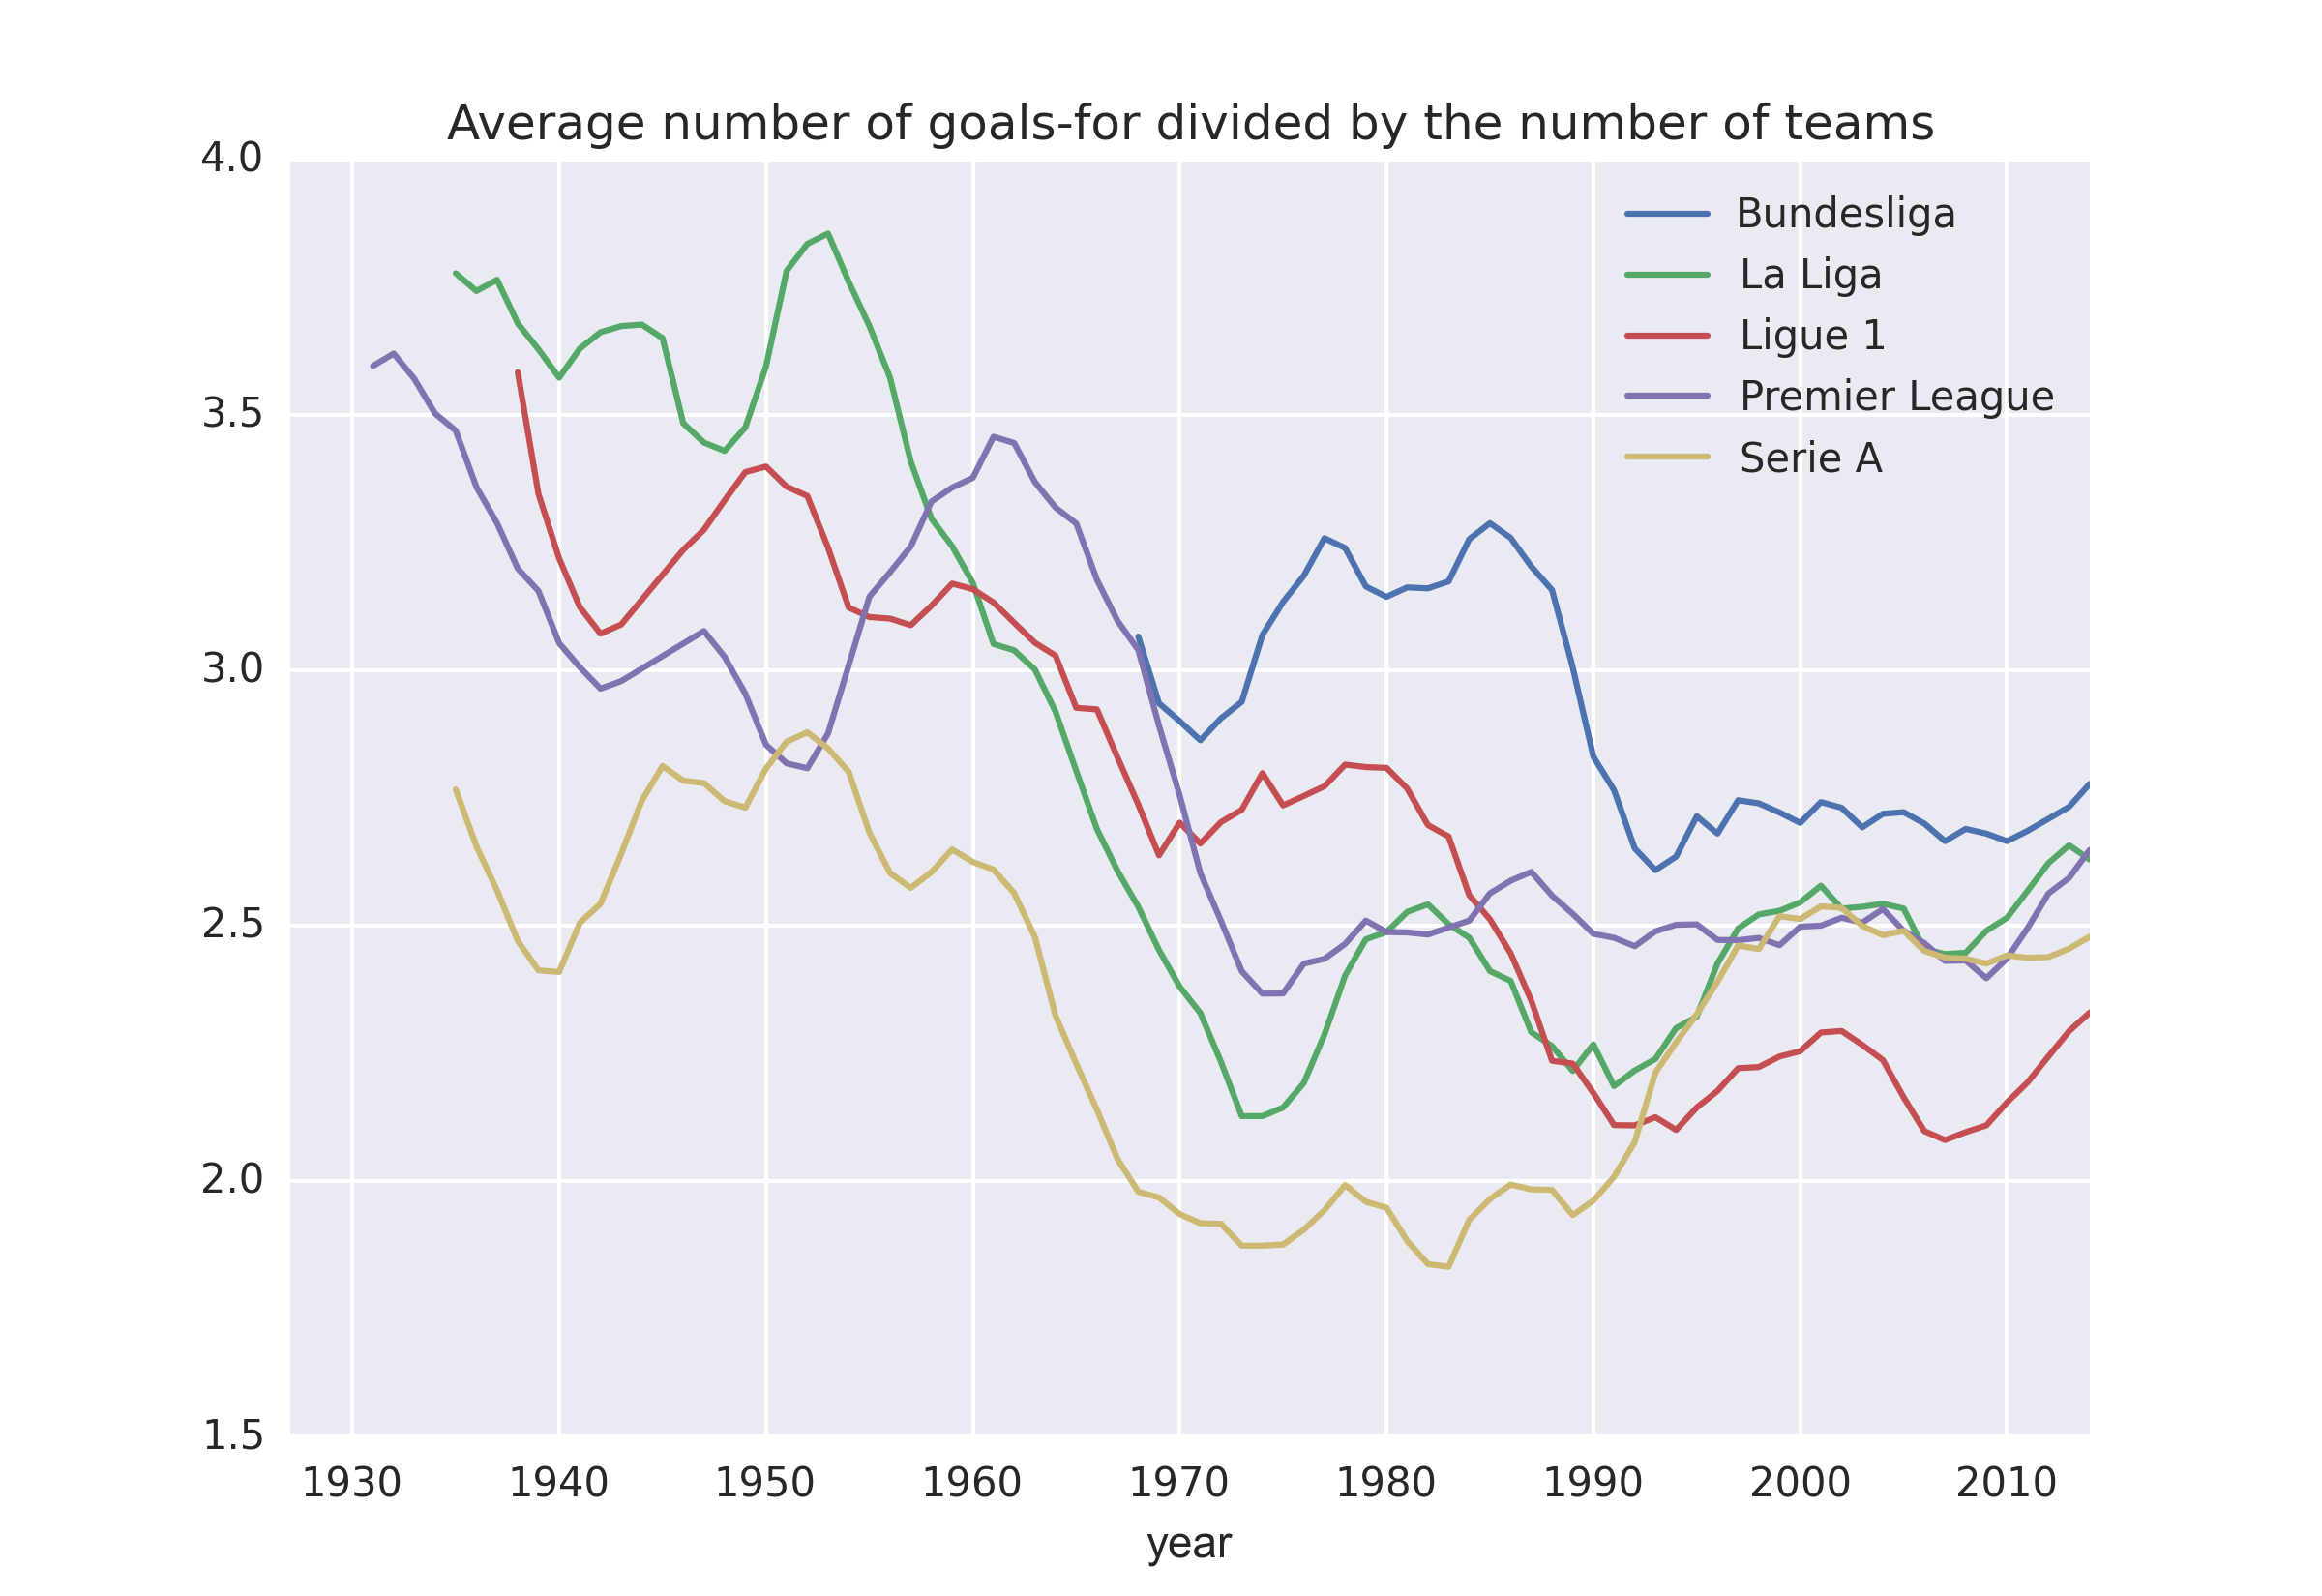
In the early 60’s all teams started to score less and less. Teams in the Premier League (the only league to have roughly a constant number of teams per season) were scoring an average of 80 goals in 1930, which dropped to 50 goals in 1980. I am not sure why this happened. I suspect it has to do with the increasing importance given to strategy and technique, rather than a bunch of guys running randomly behind a ball. Note that the Bundesliga praises, on average, the highest number of goals scored (relative to the number of teams). Ligue 1 saw a gradual drop in the average number of goals scored from 1940 to date. And right now Ligue 1 is the lowest scoring league among the five studied here.
Lastly, it is interesting to look at the two-dimensional density distribution of the data in a Drawn vs. Won plane, ignoring (but keeping in mind) that the number of teams per league is not a constant.
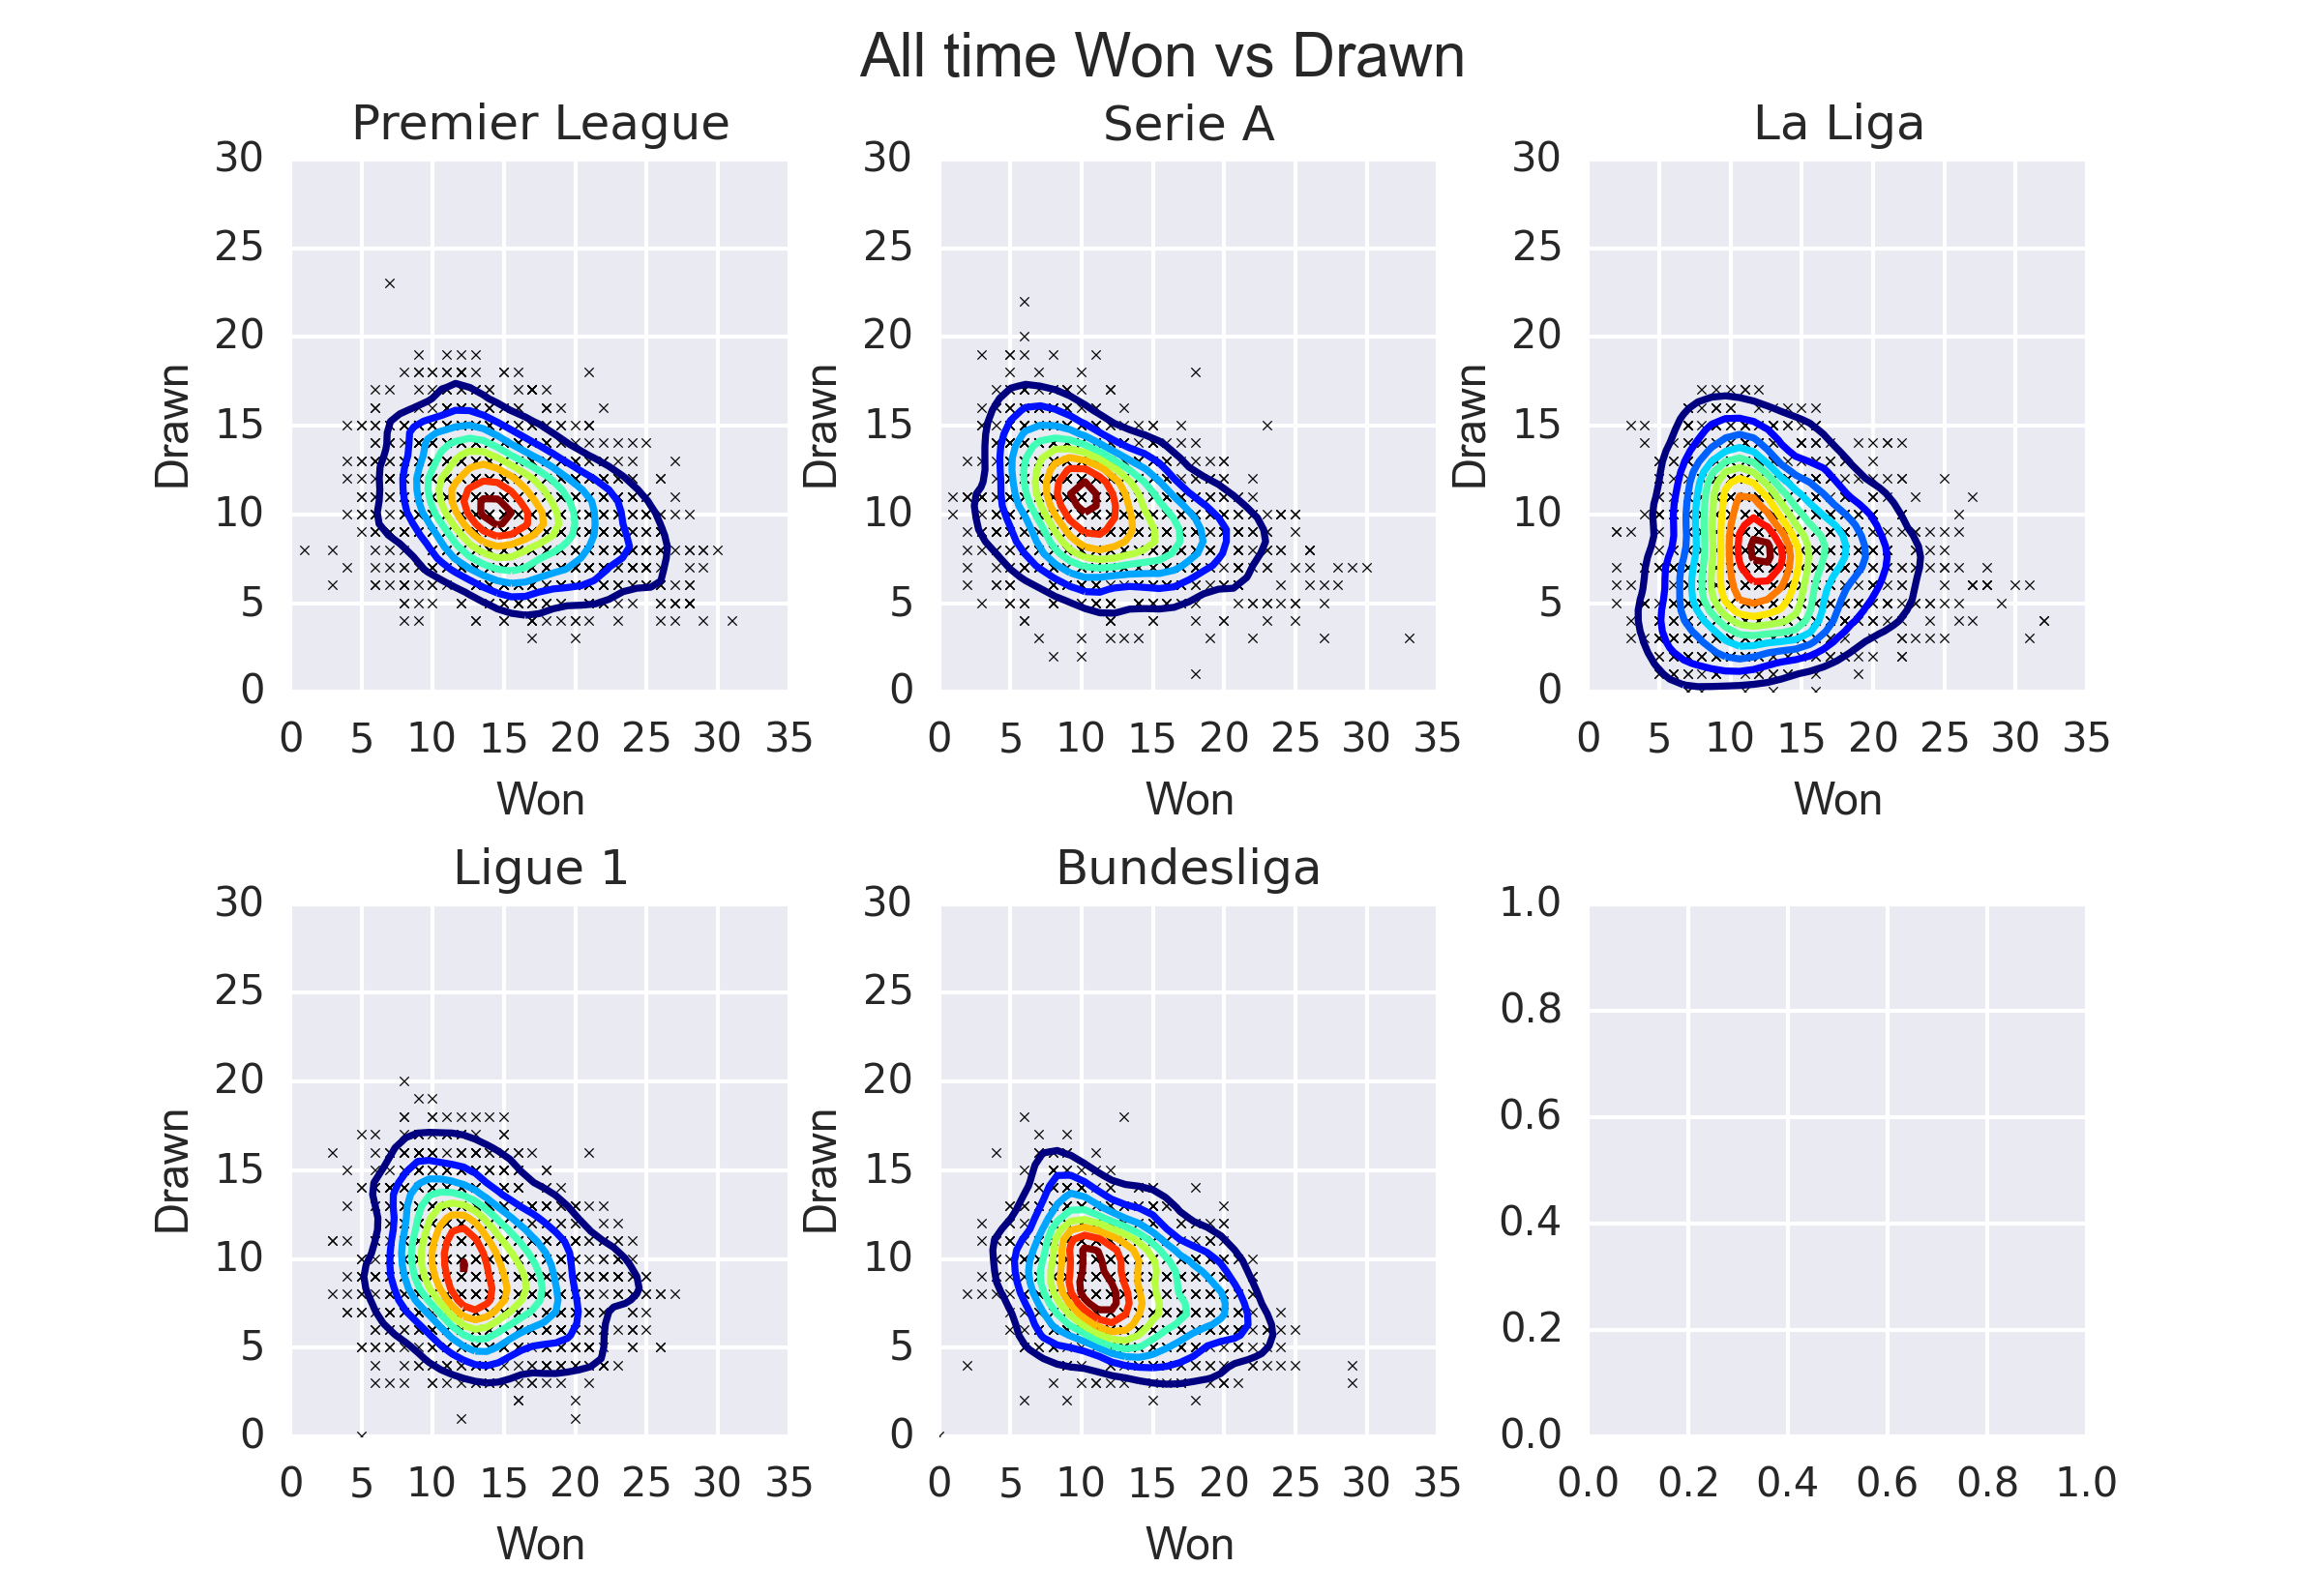
This figure tells us that Premier League teams have won an average of 15 games and have drawn an average of 10 games per season. Whereas the average Spanish team have won 13 games and have drawn 8 games per season. In other words, the average result for an average team in European leagues is to win between 10-15 games and to tie about 10 games per season. If you can do better than this, then you are one of the top teams running for the title. Note also that Ligue 1 and Bundesliga teams rarely won more than 25 games per season, conversely to Premier League, Serie A and La Liga.
Here are some record-breaking teams:
Best winning teams:
- Juventus: 33/38 victories in 2013-14
- Barcelona and Real Madrid: 32/38 victories in 2012-13 and 2011-12
- Tottenham Hotspur: 31/42 victories in 1960-61
Worst winning teams (note they are mainly English teams):
- Stoke City: 31/ 42 defeats in 1984-85
- Blackburn Rovers and Leeds United: 30/42 defeats
- Sunderland, Sporting de Gijn (and 4 more): 29/42 defeats
Best scoring teams:
- Aston Villa: 128 goals in 42 games in 1930-31
- Arsenal: 127 goals in 42 games in 1930-31
- Torino: 125 goals in 40 games in 1947-48
Worst scoring teams (note they are all Italian teams):
- Bari: 11 goals in 30 games in 1969-70
- Palermo, Mantova, Empoli: 13 goals in 30 games
- Ternana, Catania, Verona, Ascoli: 14 goals in 30 game
Moreover, these teams never lost a game during a season: Perugia (in 1978-79), Milan (in 1991-92), Juventus (in 2011-12), Madrid CF (in 1931-32), Arsenal (in 2003-04).
I suspect that comparing the results of intra-European championships (like the UEFA Champions League) will provide further insights into the differences between European leagues, especially in the early days when league statistics were considerably different from each other. In fact, looking at the figures above, I noticed that the five leagues started to behave very similarly from the year 2000 onwards. I think this is due to the increasing mix of nationalities playing and coaching in European Leagues. The playing style of different countries are merging together into what will soon become the European way of playing football.