In this post I want to discuss how you can use python to fetch data from the internet,put them in a readable format and gain some interesting insights.
This exercise is motivated by “Using SQL for Lightweight Data Analysis” by Rufus Pollock. Here, I extend Rufus’ analysis to a larger dataset and I use different analysis tools.
The data
The data come from the “London GLA spending” website, where GLA stands for Greater London Authority. Every month GLA publishes their spendings on Housing Services, Developing, Communities & Intelligence, etc. While writing, the GLA webpage contains 38 csv files with inhomogeneous formatting, empty columns and irregularly spaced data. To complicate things, the GLA website keeps changing address and html design. So, I do not guarantee that the code described below will work in the future.
The webpage looks like this:
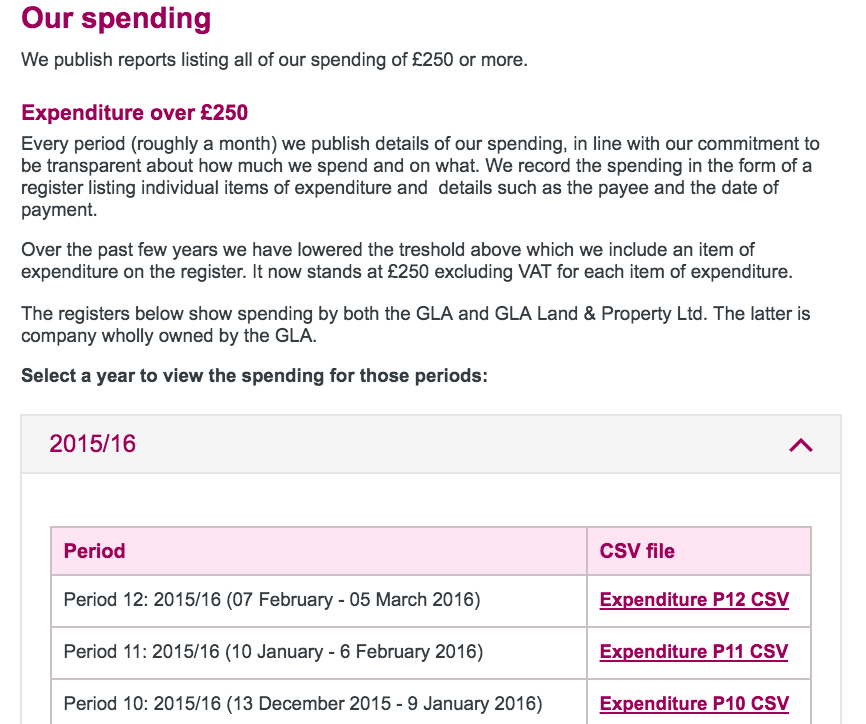
where we are interested in the content of the CSV file column.
The strategy is straightforward:
- scrap the html code of the GLA webpage;
- extract the links to the .csv files;
- download all the data and append the results to a pandas dataframe;
- clean the data
- have some fun with the data
The code
We need some standard libraries like numpy and matplotlib, plus some less standard libraries, with BeautifulSoup being the most important, because it allows to manipulate the html code hiding behind web pages. If you do not have BeautifulSoup installed, you can get it via pip install BeautifulSoup.
import pandas as pd
from bs4 import BeautifulSoup
import urllib2
import matplotlib.pylab as plt
import re
import numpy as np
from __future__ import print_function
%matplotlib inline
The html code from the GLA webpage can be extracted with:
wpage= 'https://www.london.gov.uk/about-us/greater-london-authority-gla/spending-money-wisely/our-spending'

req = urllib2.Request(wpage)
page = urllib2.urlopen(req)
soup = BeautifulSoup(page, 'html5lib')
The csv files that we need are contained in <td> tags, which are nested inside
| nan | nan | Amount | Clearing Date | Cost Element | Directorate | Document No | Expenditure Account Code Description | Service Expenditure Analysis | Vendor ID | Vendor Name |
|---|---|---|---|---|---|---|---|---|---|---|
| NaN | NaN | 66,253,087.00 | 24 Feb 2016 | 544071 | RESOURCES | CHAPS649 | FUNCTIONAL BODY GRANT PAYMENT | Highways and transport services | 10016524 | TRANSPORT FOR LONDON |
| NaN | NaN | 20,945,312.00 | 15 Feb 2016 | 544093 | RESOURCES | CHAPS627 | NLE – GRANT PMT TO TFL | Highways and transport services | 10016524 | TRANSPORT FOR LONDON |
| NaN | NaN | 17,926,156.00 | 22 Feb 2016 | 544073 | RESOURCES | CHAPS643 | BUSINESS RATE RETENTION-CLG | Highways and transport services | NC | DCLG |
Note that there are still some missing column. The Amount column is actually a string that we need to transform to float. ‘Clearing Date’ is also a string, that we want to transform to datetime format. Some columns contain strings sometimes upper cases and sometimes lower cases, which is an issue when we will use the groupby function. It is a good idea to make all strings upper cases. Unfortunately, Directorate contains missing values for some rows and there is nothing we can do about it. Lastly, we can drop Cost Element, Vendor ID and Document No because irrelevant for our analysis:
df = df[df.columns[2:]] # Remove the first two empty columns

# Amount
def clean_par(text):
    if '(' in text:
        output = ('-' + re.sub('[()]','',text))
    else:
        output = text
    return output

df['Amount'] = df['Amount'].map(lambda x: clean_par(x)) # transform '(123)' to -123
df['Amount'] = df['Amount'].map(lambda x: x.replace(',','')).astype(float) # Remove ','

# Transform to time series
df['Clearing Date'] = df['Clearing Date'].map(lambda x: pd.Timestamp(x))

# Make upper case
df['Expenditure Account Code Description'] = df['Expenditure Account Code Description'].map(lambda x: x.upper())

mask = ~df['Directorate'].isnull() # consider only non-null values
df.loc[mask,'Directorate'] = df.loc[mask,'Directorate'].map(lambda x: x.upper()) # Make upper case
df.loc[mask,'Directorate'] = df.loc[mask,'Directorate'].map(lambda x: x.replace('&','AND'))
df.loc[mask,'Directorate'] = df.loc[mask,'Directorate'].map(lambda x: x.rstrip()) # Strip white spaces
df.loc[mask,'Directorate'] = df.loc[mask,'Directorate'].map(lambda x: x.lstrip()) # Strip white spaces
df.loc[mask,'Directorate'] = df.loc[mask,'Directorate'].map(lambda x: x.replace('COMMUNIITES AND INTELLIGENCE','COMMUNITIES AND INTELLIGENCE'))

df.drop_duplicates(inplace=True) # Drop eventual duplicates
df.drop(['Cost Element','Vendor ID','Document No'], axis=1, inplace=True)
Analysis
With a clean dataset we can finally gain some insights. We can plot expenditures as a function of time:
df.sort_values('Clearing Date').plot(x = 'Clearing Date', y = 'Amount',legend=None,
    grid=True,lw=1.2, figsize=(10,6))
plt.ylabel('Amount')
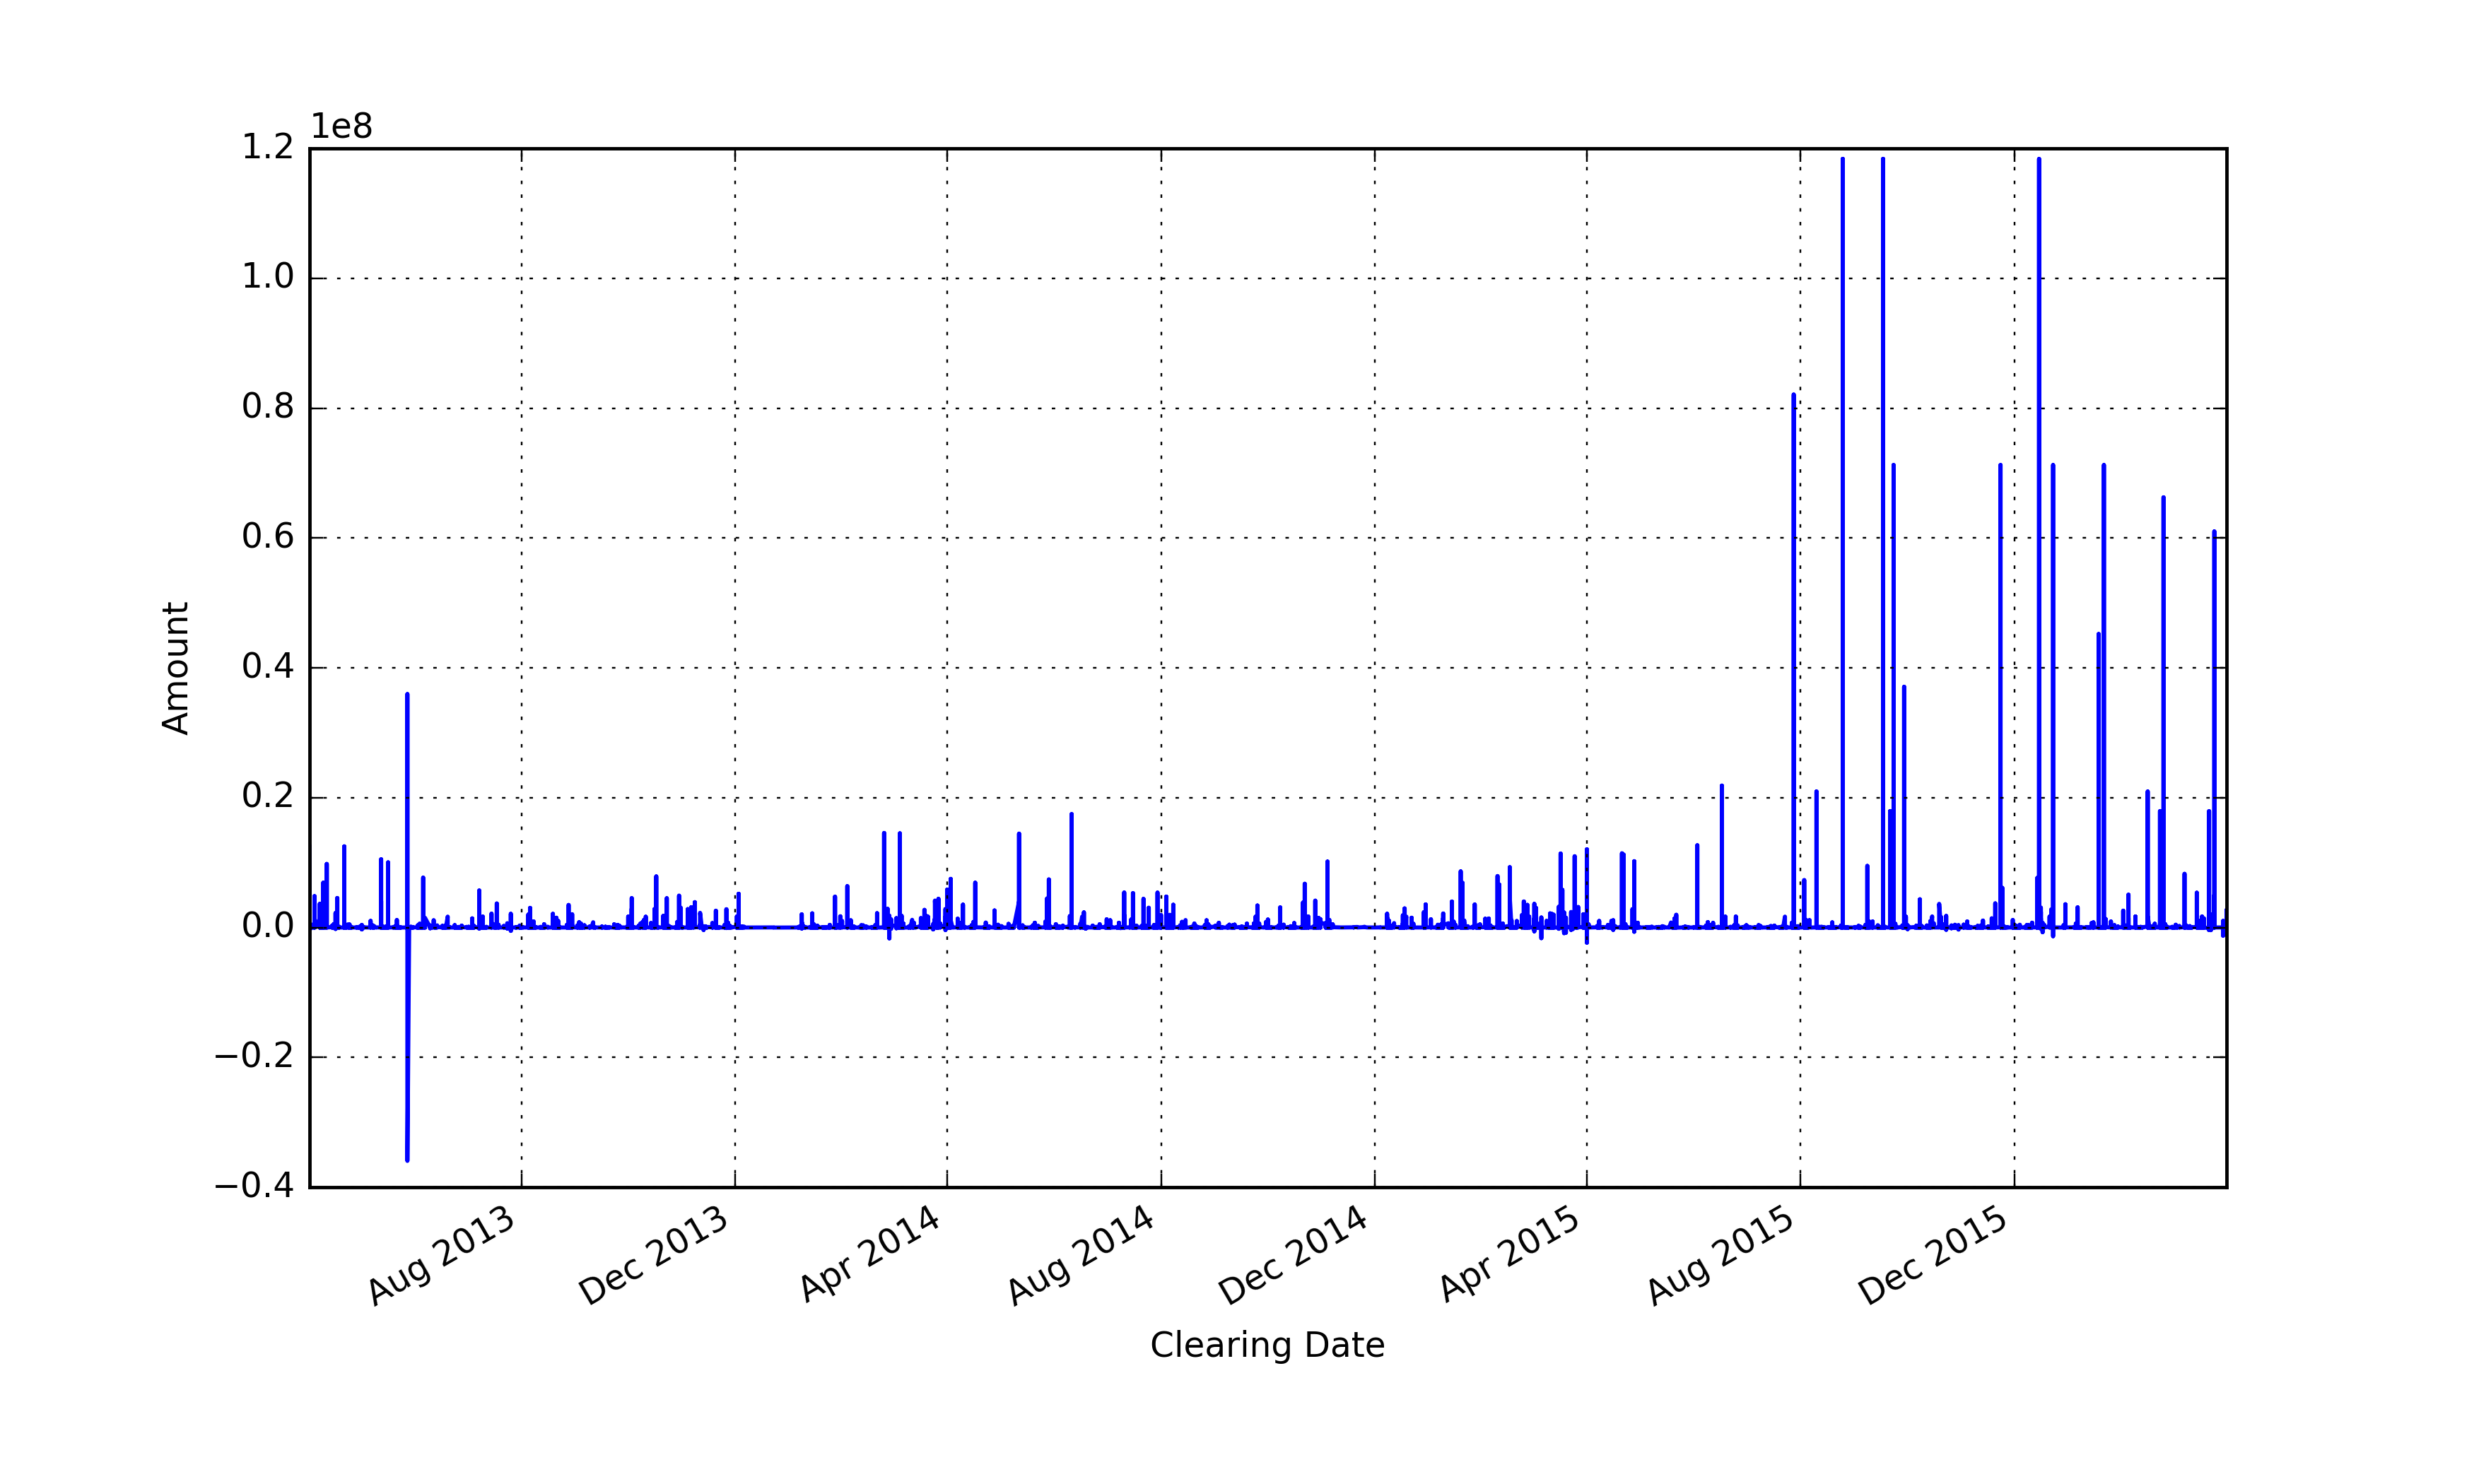
which shows that expenditures boosted after August 2015. For the record, 1e8 means 10^8 = 100,000,000 = 100 million pounds.
The most expensive payments were all devoted to the Transport for London
df.sort_values('Amount',ascending=False).drop_duplicates(subset='Amount').head(5)
| Amount | Clearing Date | Directorate Expenditure Account Code Description | Service Expenditure Analysis | Vendor Name |
|---|---|---|---|---|
| 118379401.6 | 2015-09-17 | RESOURCES FUNCTIONAL BODY GRANT PAYMENT | Highways and transport services | TRANSPORT FOR LONDON |
| 82079402.0 | 2015-07-28 | RESOURCES FUNCTIONAL BODY GRANT PAYMENT | Highways and transport services | TRANSPORT FOR LONDON |
| 71226538.0 | 2016-01-21 | RESOURCES FUNCTIONAL BODY GRANT PAYMENT | Highways and transport services | TRANSPORT FOR LONDON |
| 66253087.0 | 2016-02-24 | RESOURCES FUNCTIONAL BODY GRANT PAYMENT | Highways and transport services | TRANSPORT FOR LONDON |
| 45200000.0 | 2016-01-18 | RESOURCES FUNCTIONAL BODY GRANT PAYMENT | Highways and transport services | TRANSPORT FOR LONDON |
Which Expenditure Account Code Description received most money from GLA(top 5 rows only) ?
grouped = df.groupby('Expenditure Account Code Description')
grouped.sum().sort_values('Amount',ascending=False).head(5)
| Expenditure Account Code Description | Amount |
|---|---|
| FUNCTIONAL BODY GRANT PAYMENT | 8.860160e+08 |
| GRANTS TO EXTERNAL ORGANISATIONS | 8.219761e+08 |
| HSG GRANTS TO REGISTERED PROVIDERS | 6.410579e+08 |
| HSG GRANTS TO LOCAL AUTHORITIES | 6.048305e+07 |
| CLAIM | SETTLEMENTS 5.064087e+07 |
Which Vendor Name received most money from GLA (top 5 rows only) ?
grouped = df.groupby('Vendor Name')
grouped.sum().sort_values('Amount',ascending=False).head(5)
| Vendor Name | Amount |
|---|---|
| TRANSPORT FOR LONDON | 9.215039e+08 |
| LONDON BOROUGH OF LAMBETH | 1.110529e+08 |
| LONDON BOROUGH OF SOUTHWARK | 8.799278e+07 |
| LONDON AND QUADRANT HOUSING TRUST | 8.457841e+07 |
| LONDON BOROUGH OF LEWISHAM | 6.649843e+07 |
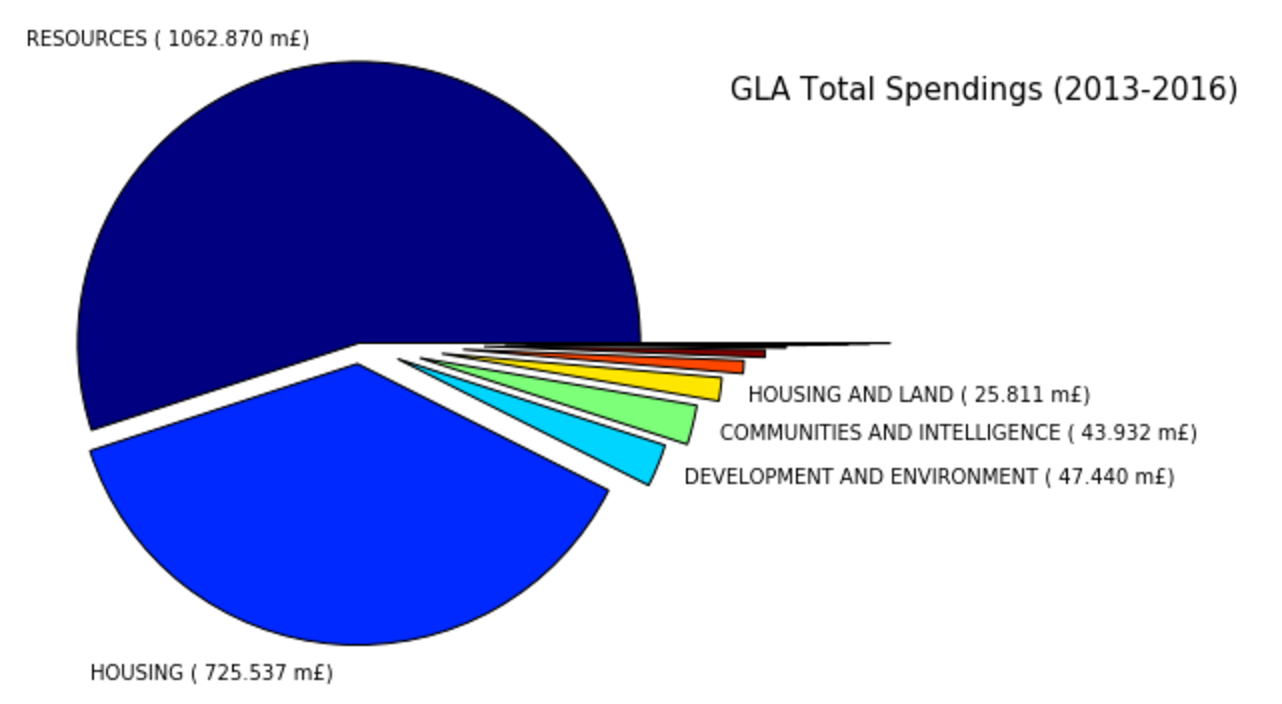
Let’s make a pie chart showing the total expenditure between 2013-16 grouped by Directorate (only top 5 shown):
# Filter out rows with missing 'Directorate' and group the result
grouped = df[~df['Directorate'].isnull()].groupby('Directorate')
total = grouped.sum().sort_values('Amount',ascending=False) # Sort by 'amount'
# Reformat the 'Amount' column
float_formatter = lambda x: &amp;quot;%.2f&amp;quot; % x
format_amount = (total.Amount.values/10**6)
format_amount = [ '{:0.3f}'.format(x) for x in format_amount ]
labels = total.index.values + ' ( ' + format_amount + ' m' + u'\u00A3)'
# Show only first 5 labels
labels[5:] = ''
cmap = plt.cm.jet
colors = cmap(np.linspace(0., 2., len(total)))
explode = tuple(np.linspace(0,0.8,len(total)))
plt.figure(figsize=(7,7))
patches, texts = plt.pie(total['Amount'], radius=0.9, startangle=0,
colors=colors, explode=explode, labels=labels)
_ = [texts[i] for i in range(0,len(total))]
plt.title('GLA Total Spendings (2013-2016)', x=1.3,y=0.8, fontsize=15)
Amount spent for each directorate grouped by year. Note the log scale on the x-axis
df['year'] = map(lambda x: x.year, df['Clearing Date'])
grouped = df.groupby(['Directorate','year']).agg({'Amount':sum})
df2 = grouped.unstack()
df2.plot.barh(logx=True,figsize=(7, 7), stacked=False, legend=False)

labels = df2.columns.get_level_values(1).values
plt.legend(title='YEAR', loc=9, bbox_to_anchor=(1.2,1), labels=labels)

plt.xlabel(u'log (Amount) in \u00A3  ')
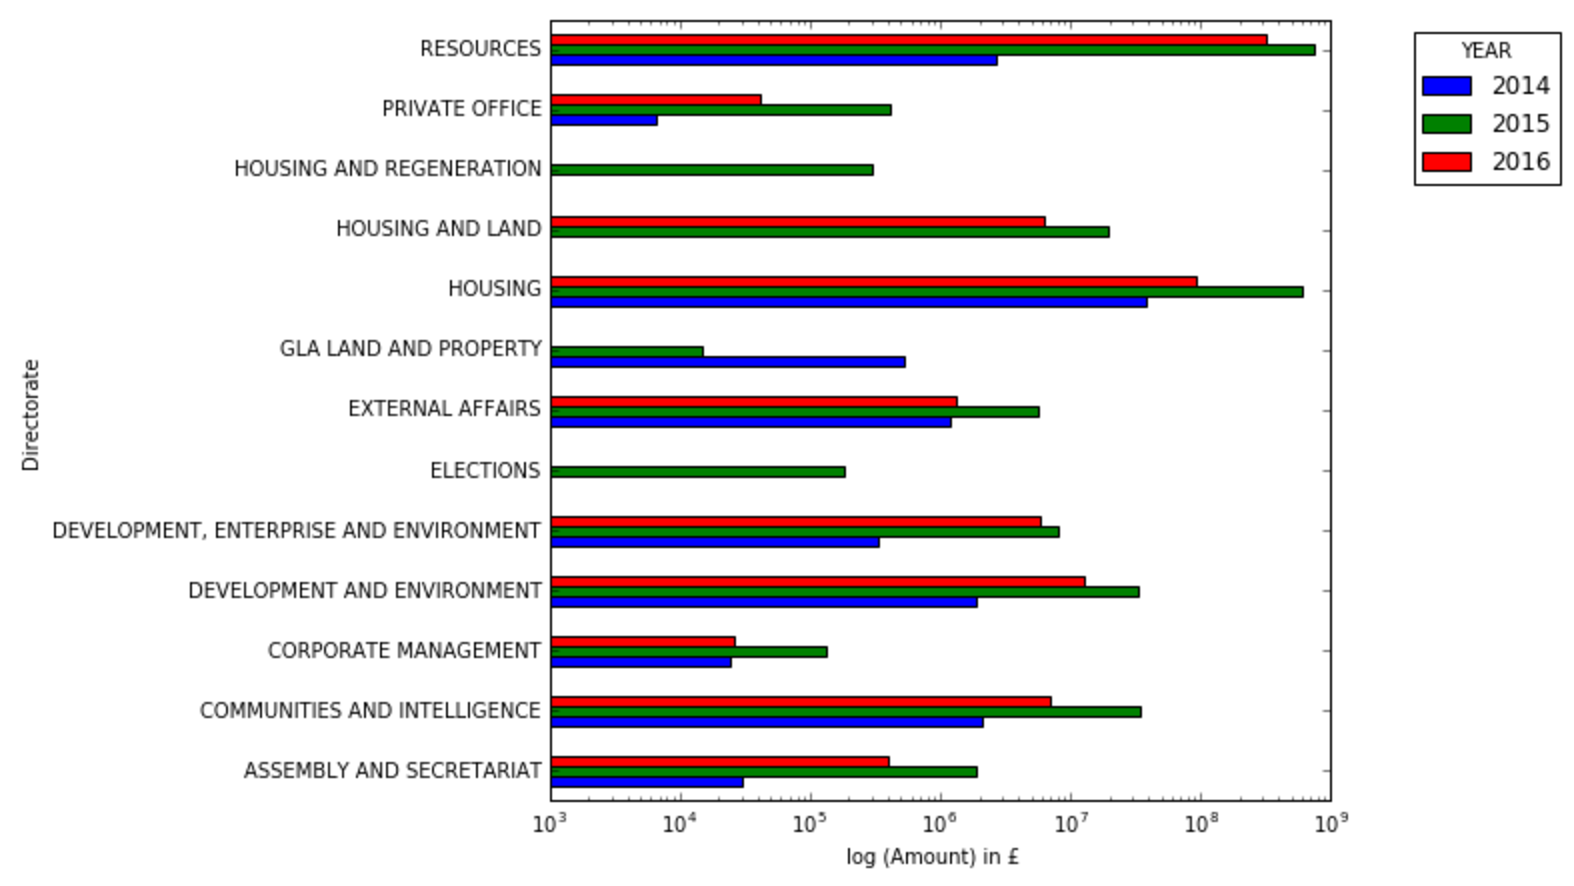
I do not know if DEVELOPMENT and ENVIRONMENT is the same as DEVELOPMENT, ENTERPRISE and ENVIRONMENT, or if HOUSING AND REGENERATION is a different name for HOUSING AND LAND. If so, their total Amount should be summed together.
While writing, we are only half way through 2016, which explains why the expenditure in 2016 is generally less than expenditure in 2015.
Wrapping up
BeautifulSoup is a simple and powerful python library to extract information from web pages (html and xml files). I have shown how to use BeautifulSoup to extract .csv files from the Greater London Authority web page and read their content using pandas, which is by far the best library for data analysis with python.
GLA spent almost 1 billion of pounds (921,503,900 pounds to be exact) for Transport for London (good, very good…) from April 2013 to March 2016, followed by housing services and all the different London boroughs. About 40% of GLA budget goes to housing-related services.
You can find the original notebook here in my GitHub account.